
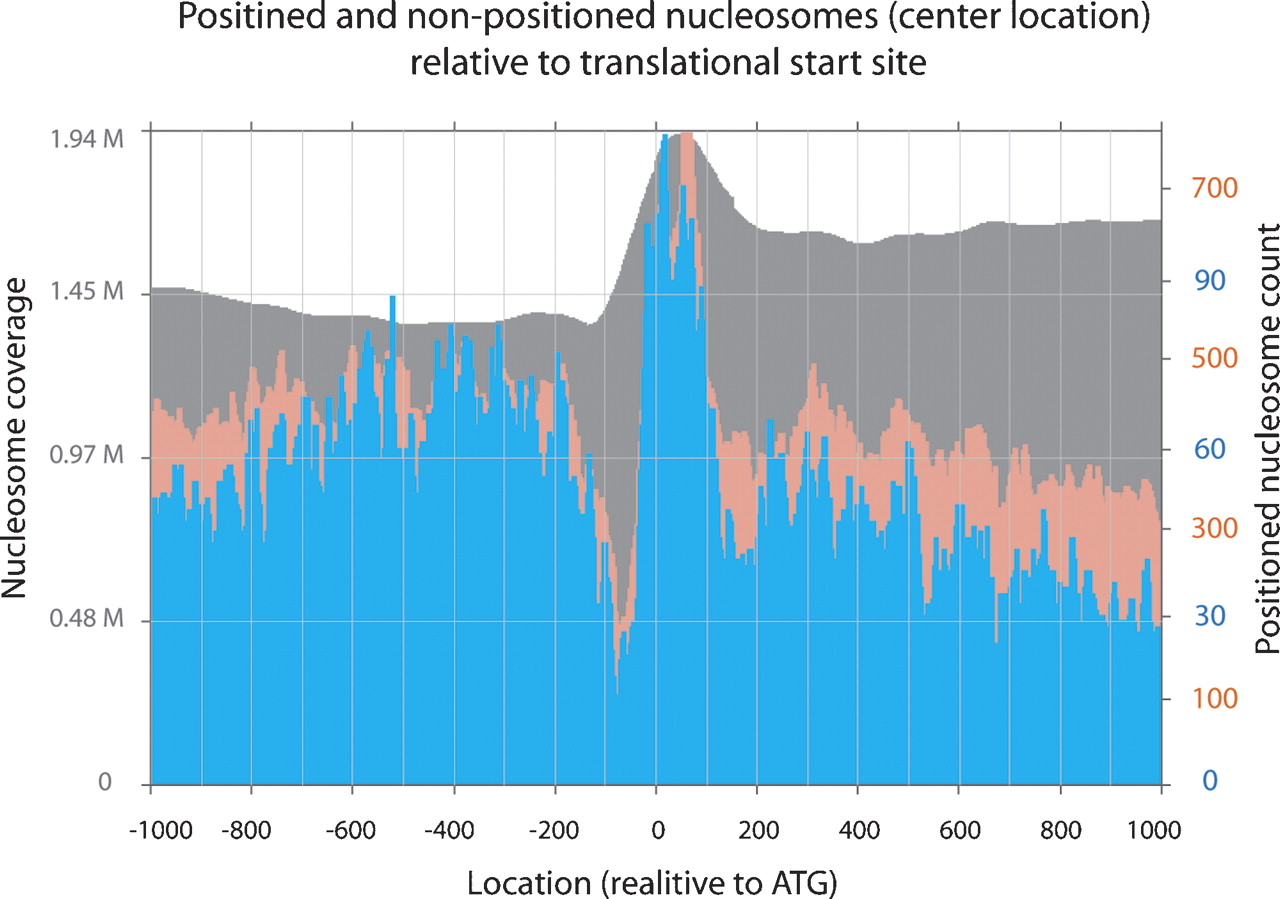
Figure 6.
Positioned nucleosomes relative to the translation start site. Using the positioned nucleosome data from 20% (pink) and 33% (blue) positioning stringency cutoffs, the number of positioned nucleosome dyads (vertical axis) is plotted relative to the ATG of the translational start sites of all annotated RefSeq genes (UCSC genome browser) (horizontal axis). The gray plot in the background depicts the nucleosome coverage from the complete data relative to ATG over the entire genome.


