
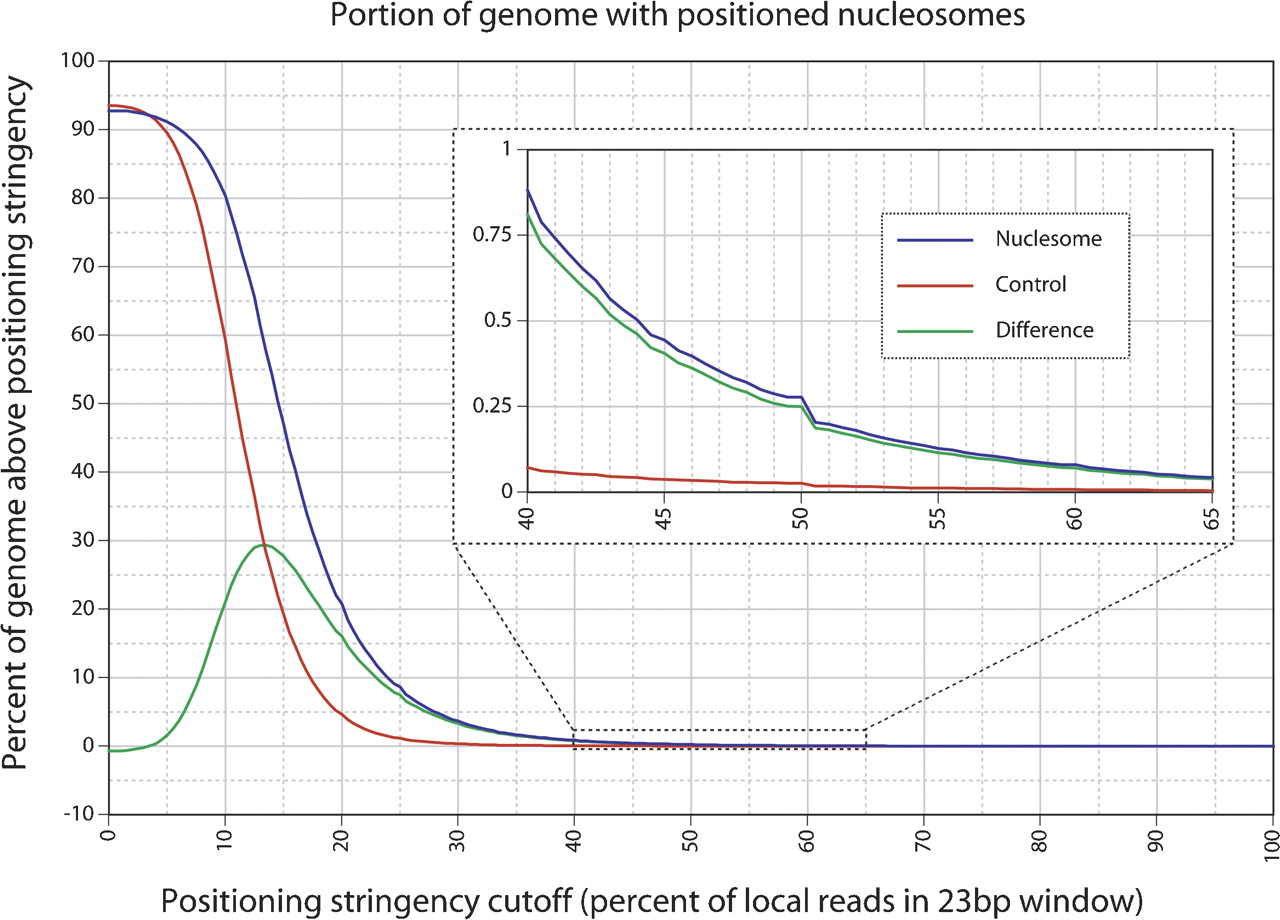
Figure 5.
Portion of the C. elegans genome with positioned nucleosomes. The percent of the genome (vertical axis) that falls above as specified positioning stringency cutoff (horizontal axis). The blue line is obtained from the nucleosome data, the red line is obtained from the negative control non-nucleosomal data (background), and the green line indicates the difference between the two (net positioning). The inset graph is the same data expanded between the 40% and 65% stringency cutoff levels.


