
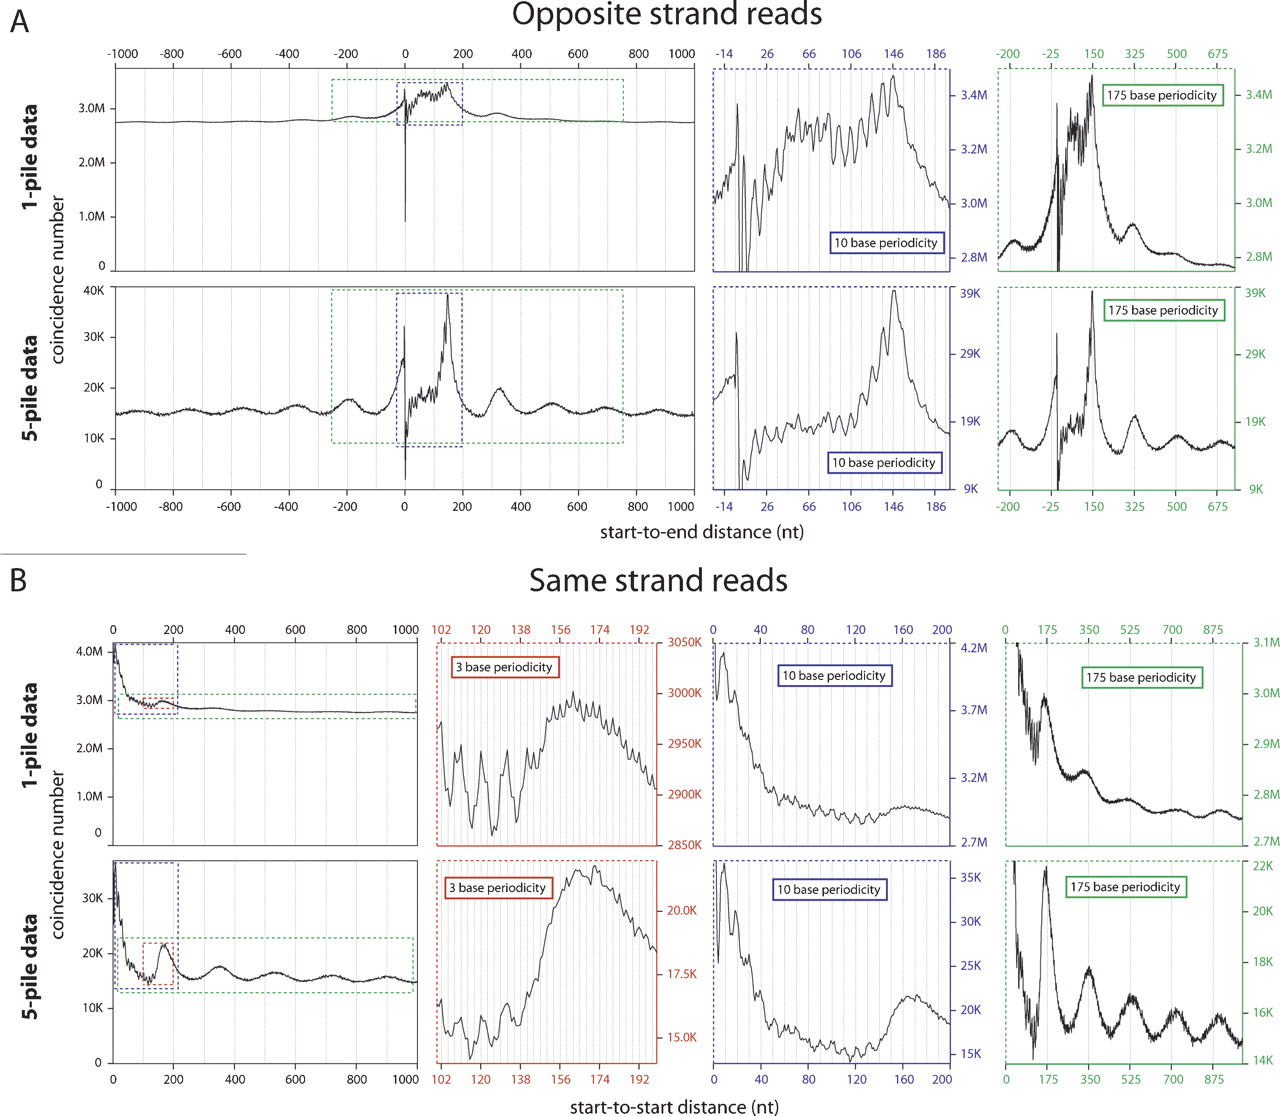
Global analysis of positional relationships between individual pan-cellular and neighboring nucleosomes. (A) Start-to-End distances for reads mapped to opposite strands. The graph shows total pairs of nucleosomes with a Start-to-End distance corresponding to the value on the X-axis. The dominant peak corresponding to position 146 (the 147th base from the start of the read) demonstrates reproducible positioning of nucleosomes at the same loci across cells. The colored graphs to the right zoom in on the same data (areas demarked by colored dotted lines), but highlight the 175-base periodicity reflecting the phasing on neighboring nucleosomes (green graph) and the 10-base periodicity indicative of rotational positioning of nucleosomes (blue graph). (B) Start-to-Start distances of reads mapped to the same strand. The graph shows total pairs of nucleosomes with Start-to-Start distance corresponding to the value on the X-axis. A subtle broad peak is located at approximately base 175, with echoes of this peak at a periodicity of 175 bases (green graph). A 10-base periodicity (blue graph) is also seen extending out from the start site, but is somewhat obscured by an underlying 3-base periodicity (red graph). In A and B the top set of graphs are generated form the total data (1-pile data) and the bottom graphs are generated from data enriched for positioned nucleosomes (5-pile data). This enrichment results in a greater relative amplitude of the major signal for reproducibility in absolute nucleosome positioning (A, bottom graph, major peak at 146) and in relative positioning (A,B, bottom, green graphs), but slightly decreases the resolution of the 10-base periodicity (A,B, bottom, blue graphs) and makes the 3-base periodicity (B, bottom, red graph) less prominent due to greater noise in the signal from the smaller data set (only 1/28th the size of nonenriched data set).


