
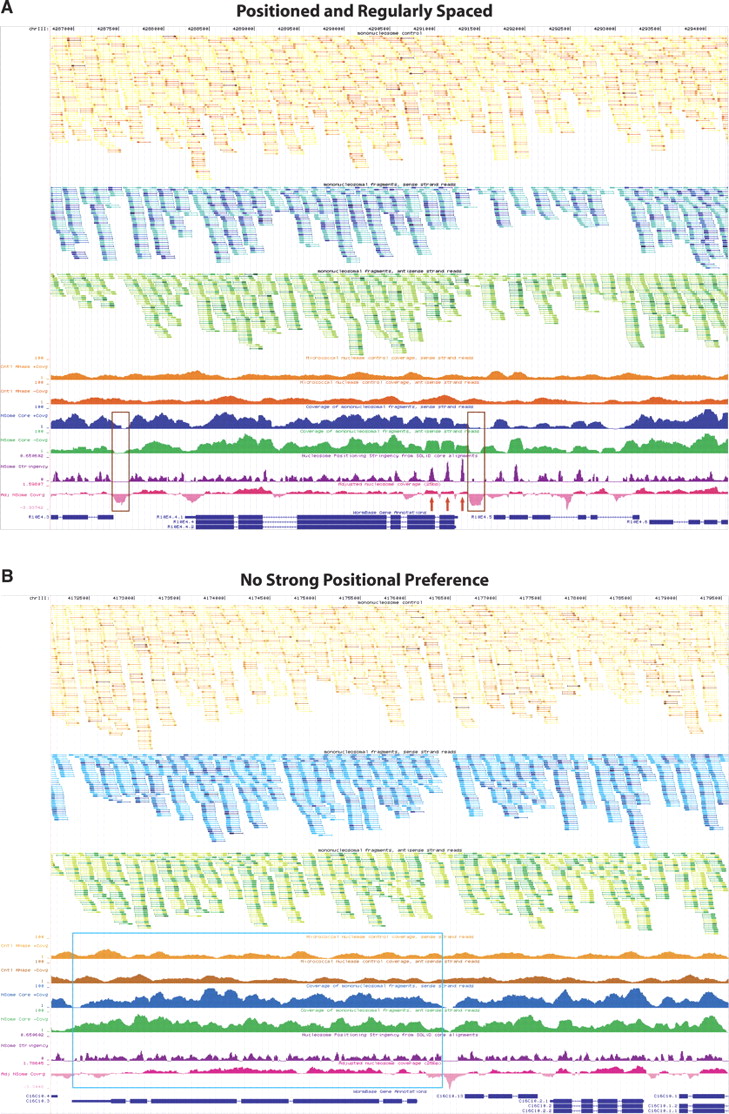
UCSC Genome Browser displaying custom tracks of the Caenorhabditis elegans nucleosome position map. (A) Browser shot of the mcm-5 gene locus with several preferentially positioned nucleosomes in an organized array (red arrows). Nucleosome-depleted regions upstream of the ATG are highlighted by brown boxes, a common feature of many actively transcribed genes as noted by several groups (Yuan et al. 2005; Albert et al. 2007; Lee et al. 2007; Lin et al. 2007; Whitehouse et al. 2007; Schones et al. 2008; Shivaswamy et al. 2008; Yuan and Liu 2008). (B) A representative locus (displaying gene C16C10.3) in the genome demonstrating lack of nucleosome positioning particularly across a 3.5-kb stretch (highlighted by the blue box) possibly due to random nucleosome occupancy. In both A and B the top three tracks display raw data from control (orange) and nucleosome (forward blue and reverse green) experiments. Tracks two and three represent 147 nt stretches of putative nucleosome cores from forward (blue) and reverse (green) reads, with the first 50 sequenced nucleotides indicated by a thick portion of the track feature. Track one displays both forward and reverse control data (orange) in a similar fashion as the nucleosome data. The nucleosome core and genomic DNA control reads have been collapsed and colored such that multiple reads starting at the same nucleotide are represented by a single feature that varies in hue from lightest to darkest depending on the number of instances. Lightest to darkest hues correspond to the following categories: one read instance, two read instances, three to five instances, six to 10 instances, and >10 instances, respectively. Tracks four and five (coverage of nucleosome control, sense/antisense strand reads) display the coverage by 147 nt stretches from the control data. Tracks six and seven (coverage of mononucleosomal fragments, sense/antisense strand reads) show coverage by putative nucleosome cores inferred from reads that map to sense (blue) or antisense (green) strand of the reference genome. Track eight (purple) evaluates nucleosome positioning stringency at every base pair varying between 0 and 1, such that 1.0 corresponds to 100% positioning and 0.0 corresponds to no positioning or insufficient data. Track nine (adjusted nucleosome coverage, pink) displays nucleosome coverage (on a log2 scale) relative to control data to account for sequencing and enzymatic biases. Areas falling below 0.0 are on average more depleted for nucleosomes, while areas above 0.0 have increased frequency of nucleosome instances. ±1 indicates a twofold increase or depletion of putative nucleosome cores at that position.


