
Number of nonoverlapping 100-kb windows that overlap with selected regions, as identified in other studies
Click on table to view larger version.
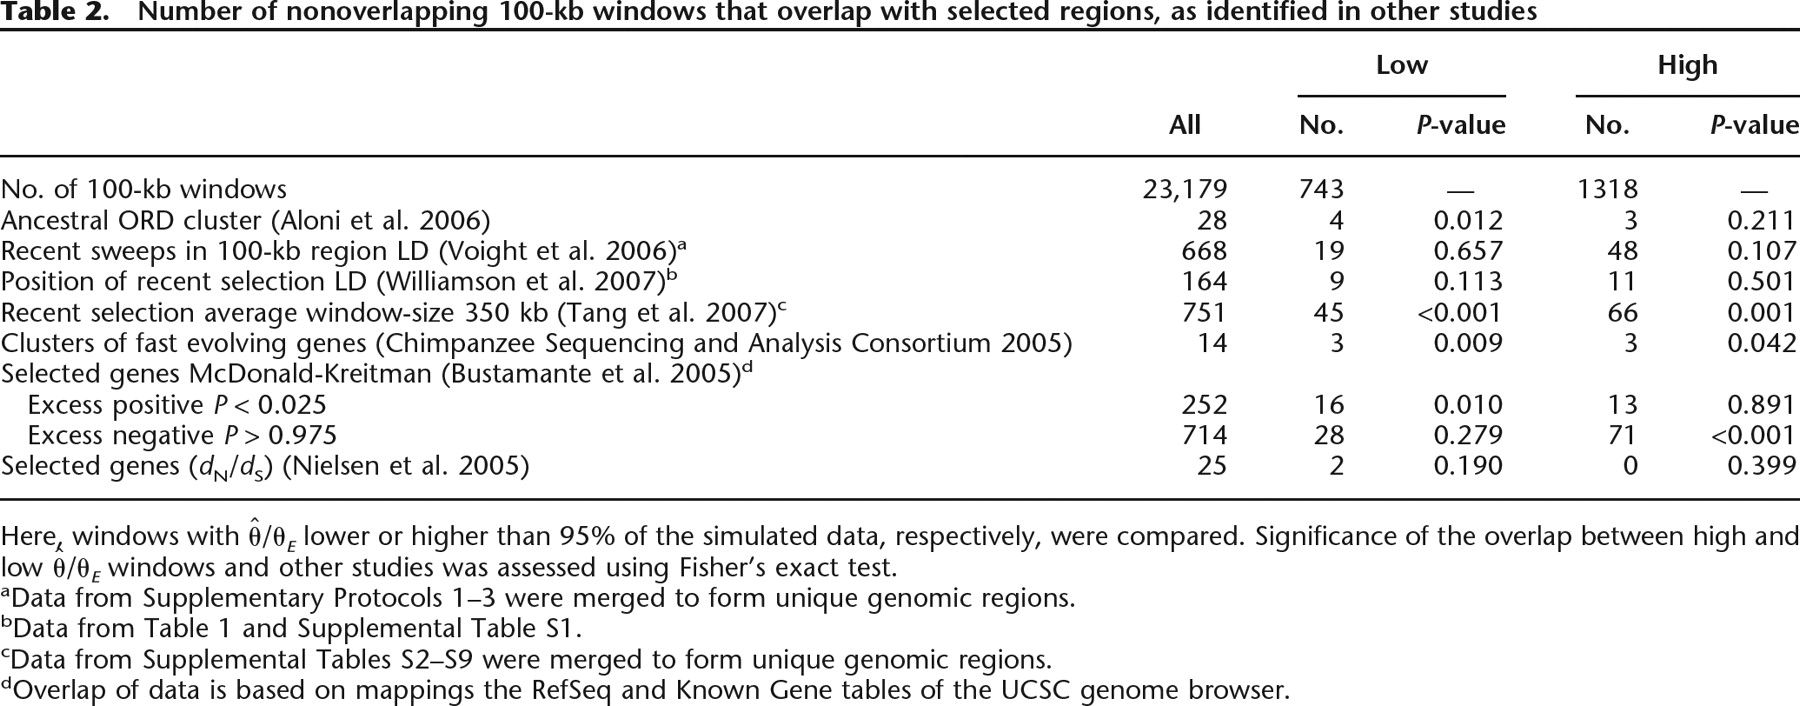
Here, windows with  /θE lower or higher than 95% of the simulated data, respectively, were compared. Significance of the overlap between high and
low
/θE lower or higher than 95% of the simulated data, respectively, were compared. Significance of the overlap between high and
low  /θE windows and other studies was assessed using Fisher’s exact test.
aData from Supplementary Protocols 1–3 were merged to form unique genomic regions.
bData from Table 1 and Supplemental Table S1.
cData from Supplemental Tables S2–S9 were merged to form unique genomic regions.
dOverlap of data is based on mappings the RefSeq and Known Gene tables of the UCSC genome browser.


