
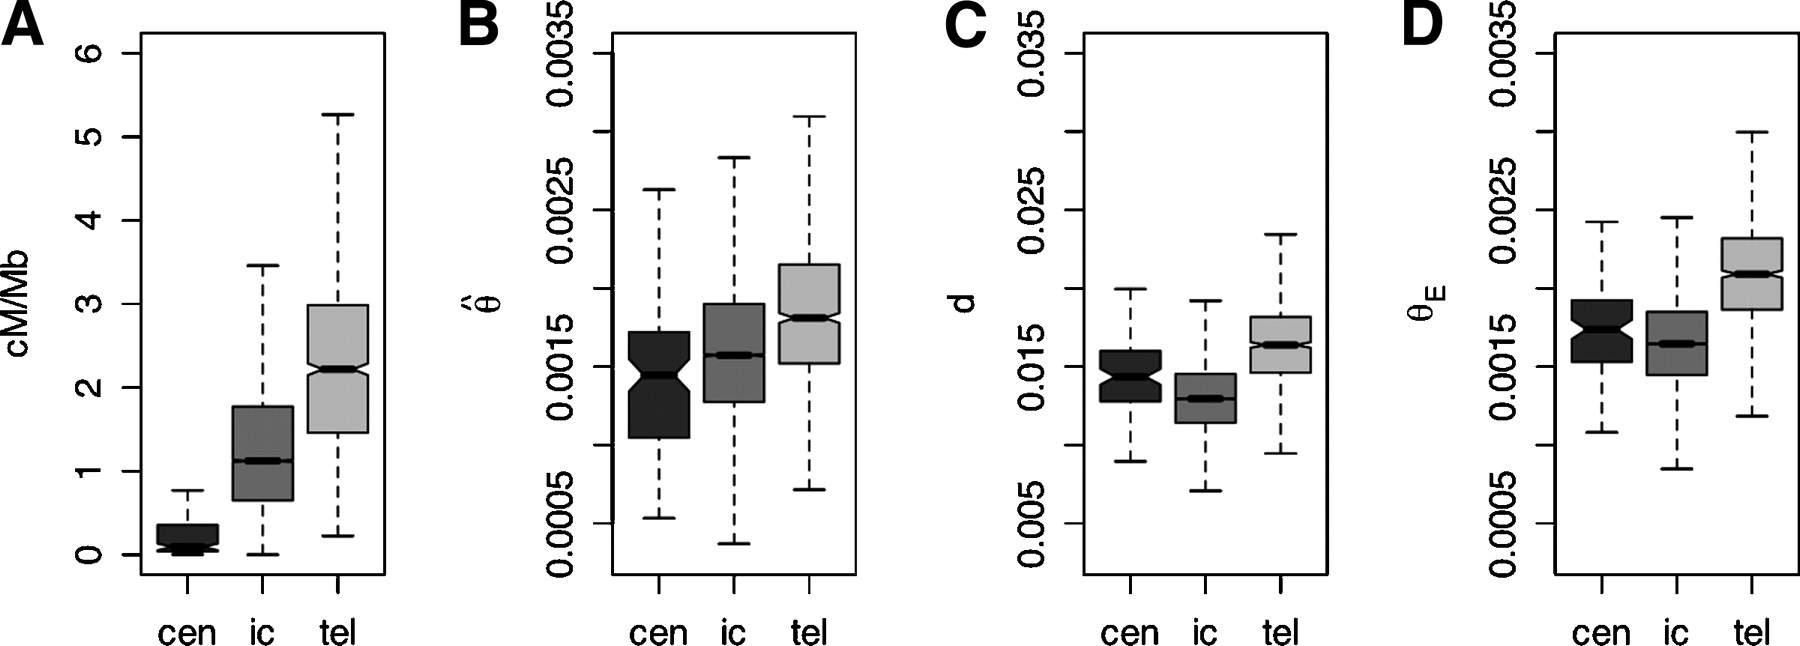
Figure 4.
Centromeres (cen) and Telomeres (tel) behave differently from intrachromosomal (ic) regions in their recombination rates (A), diversity  (B), human–chimpanzee divergence (C), and hence, also in the predicted value θE (D). However,
  for centromeres and telomeres is smaller than θE.


