
Figure 3.
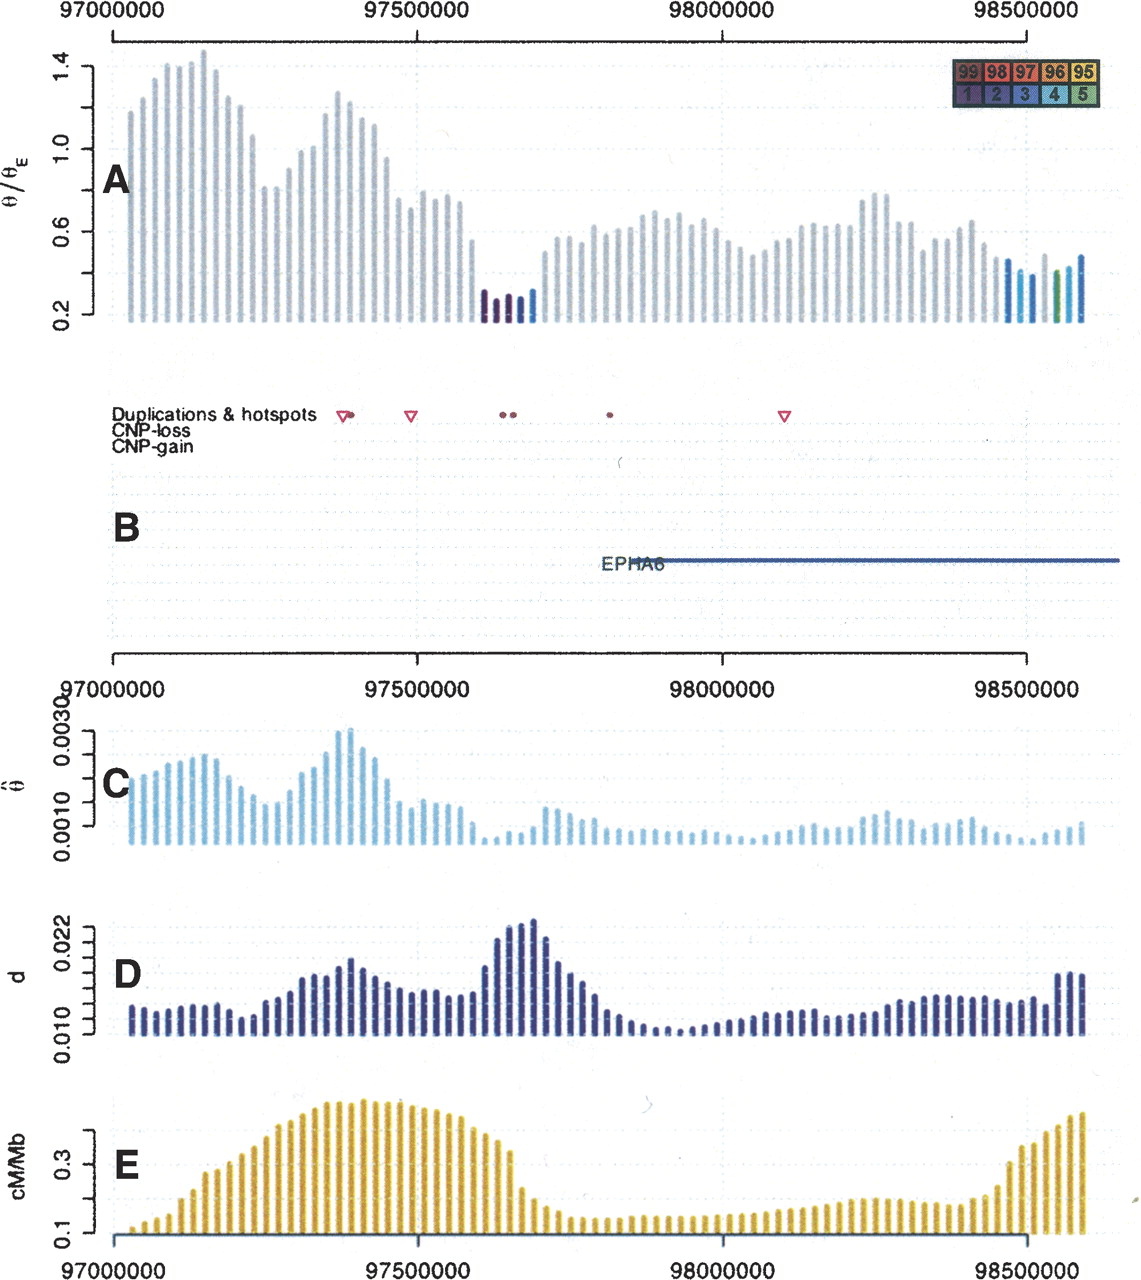
The area around the second lowest value of  /θE on chromosome 3. Vertical bars represent the values for a 100-kb window positioned at their midpoint. (A) Plotted is
  /θE, whereas the expected value is either under a neutral or a background selection model, whatever was more conservative. The
colors of the bars indicate whether
/θE, whereas the expected value is either under a neutral or a background selection model, whatever was more conservative. The
colors of the bars indicate whether  /θE lie outside of a 95%, 96%, etc., confidence interval obtained through simulations. (B) Pink triangles mark recombination hotspots; blue lines correspond to genes from the RefSeq gene track of the UCSC genome
browser. The closest gene is EPHA6. (C–E) The values for
/θE lie outside of a 95%, 96%, etc., confidence interval obtained through simulations. (B) Pink triangles mark recombination hotspots; blue lines correspond to genes from the RefSeq gene track of the UCSC genome
browser. The closest gene is EPHA6. (C–E) The values for  , human–chimpanzee divergence, and the recombination rate in cM/Mb are plotted.


