
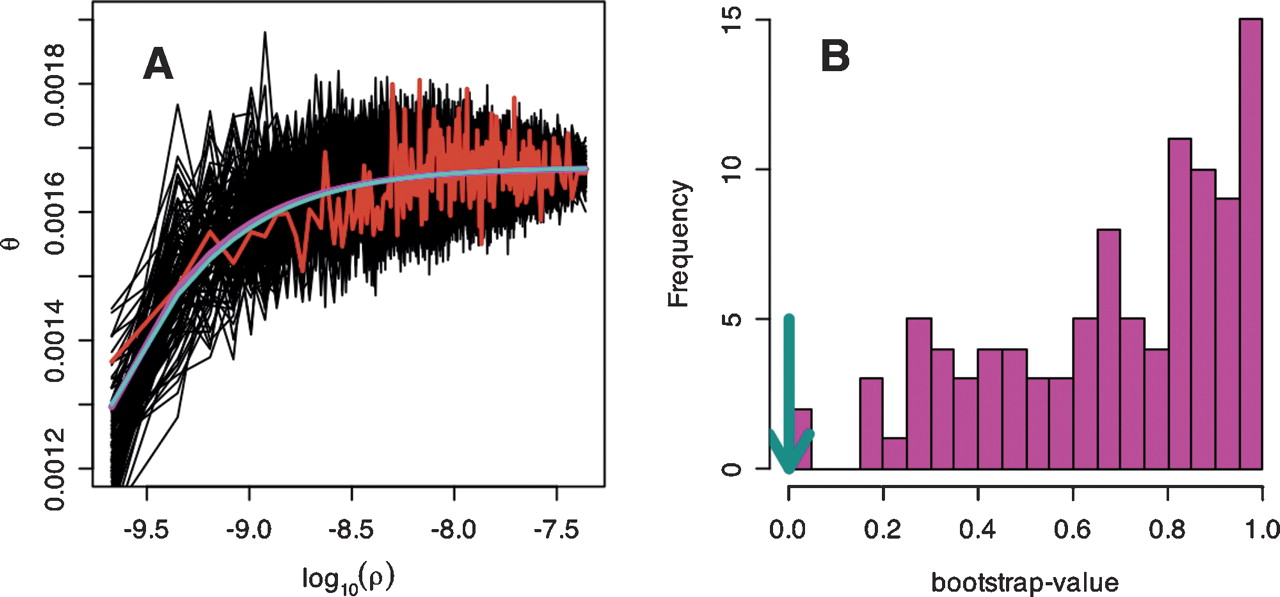
Relationship between recombination rate and diversity. Non-overlapping windows were ordered according to recombination rate
and sorted into bins of 100 windows. (A) The average  /d for the bins was plotted against the average recombination rate as log(ρ), where ρ is the number of recombinants per base per meiosis (red line). For these binned data, we also estimated the parameters
for a simple hitchhiking model (HH, cyan line) and a simple background selection model (BS, purple line).
/d for the bins was plotted against the average recombination rate as log(ρ), where ρ is the number of recombinants per base per meiosis (red line). For these binned data, we also estimated the parameters
for a simple hitchhiking model (HH, cyan line) and a simple background selection model (BS, purple line).  /d vs. log(ρ) is also drawn for 100 simulated data sets under the BS-model (black lines). (B) For 100 data sets simulated under the BS-model, we estimated the parameters for the HH- and BS-models. Given these new estimates,
we counted how often the BS-model fits better than the HH-model by using the sum of squares and bootstrapping over the bins.
In most cases, the BS-model fit consistently better (bootstrap-value closer to 1); but for the real data, the HH-model gave
a slightly better fit (cyan arrow).
/d vs. log(ρ) is also drawn for 100 simulated data sets under the BS-model (black lines). (B) For 100 data sets simulated under the BS-model, we estimated the parameters for the HH- and BS-models. Given these new estimates,
we counted how often the BS-model fits better than the HH-model by using the sum of squares and bootstrapping over the bins.
In most cases, the BS-model fit consistently better (bootstrap-value closer to 1); but for the real data, the HH-model gave
a slightly better fit (cyan arrow).


