
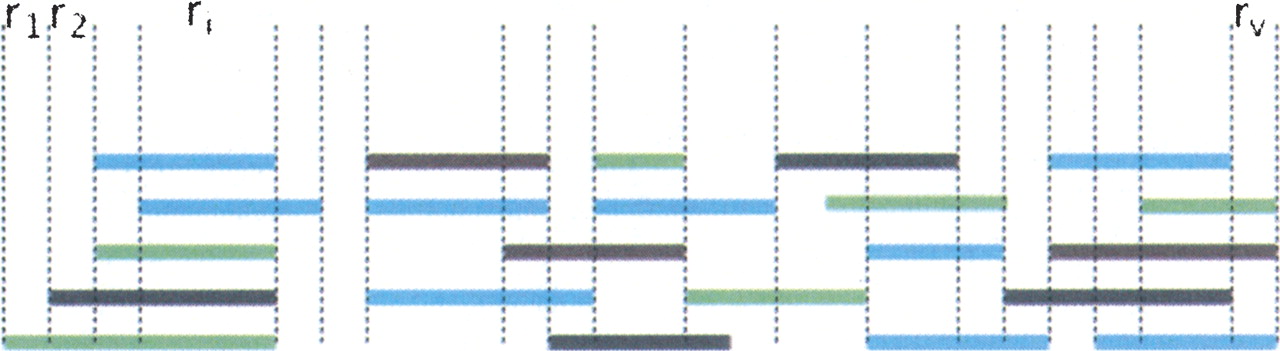
Figure 1.
Schematic drawing of shotgun reads for one window. The colored bars represent the reads; each color corresponds to a different individual. For our analysis, the window is subdivided into v different segments, so that the sampling depth of reads is invariable within a segment. For example, in segment ri, we have sampled five reads, corresponding to three individuals, and two individuals have been sampled twice. Therefore, the minimal and maximal number of chromosomes sampled is nmin = 3 and nmax = 5, respectively.


