
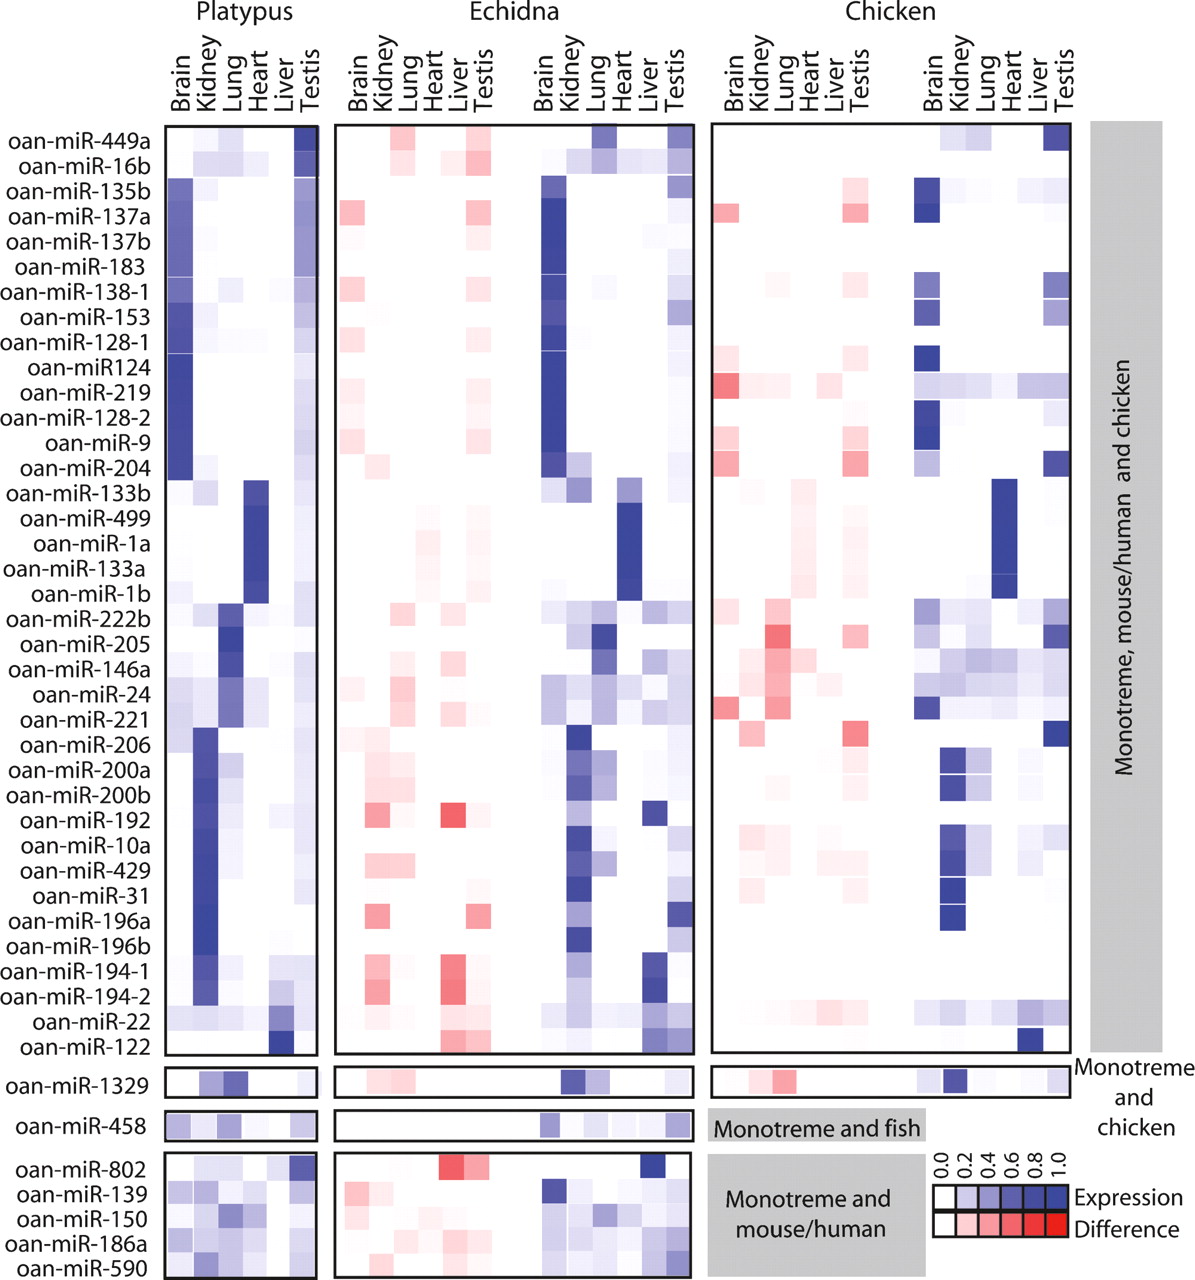
Conservation of microRNA expression patterns in monotremes. Comparison of platypus/echidna and platypus/chicken miRNA tissue expression profiles. miRNA orthology was determined by perfect match (platypus and echidna) or at least 16-nt identity in the mature miRNA (mouse, human, chicken, and fish). The expression score represented by blue squares is a ratio of the number of normalized reads in that tissue versus all tissues in that organism, and the difference score represented by red squares is the difference between the confidence intervals of the expression ratios for each platypus/echidna or platypus/chicken pair of miRNAs. A subset of miRNAs shared between monotremes, mouse/human, and chicken; monotreme and chicken; monotreme and fish; and monotreme and mouse/human are shown. miRNAs with the most distinct tissue-specific expression patterns are shown here clustered by tissue expression; the complete data sets can be found in Supplemental Figs. 1–4.


