
Table 2.
Changes in miRNA expression
Click on table to view larger version.
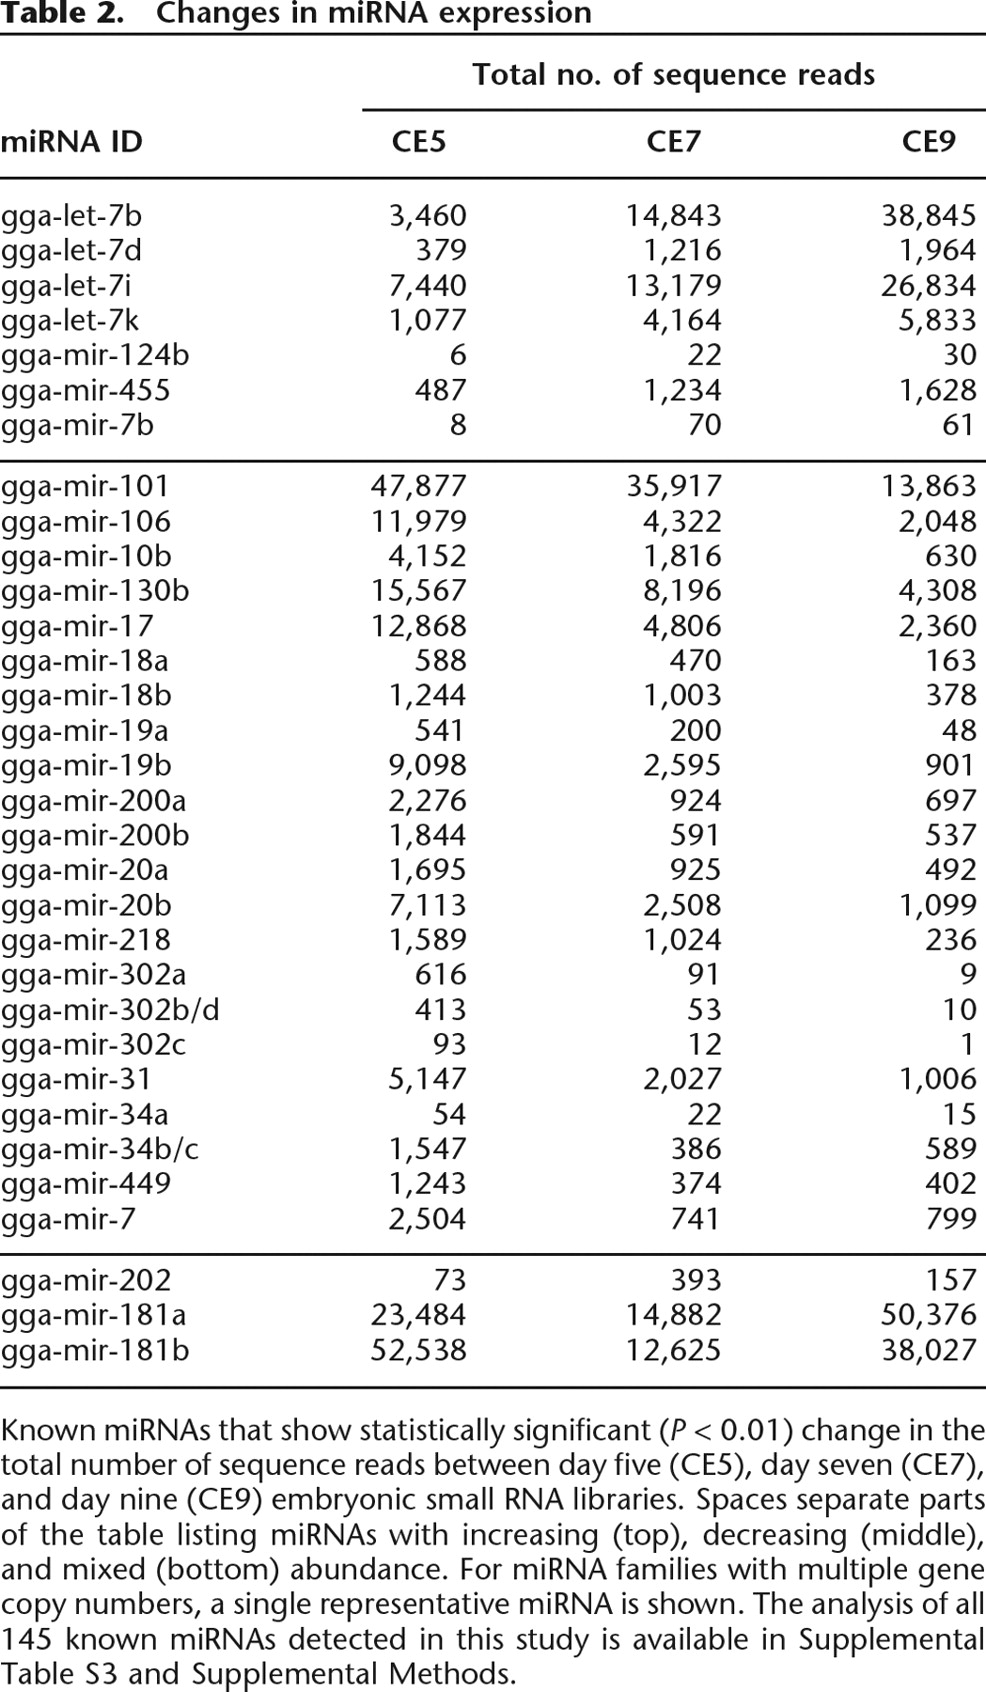
Known miRNAs that show statistically significant (P < 0.01) change in the total number of sequence reads between day five (CE5), day seven (CE7), and day nine (CE9) embryonic small RNA libraries. Spaces separate parts of the table listing miRNAs with increasing (top), decreasing (middle), and mixed (bottom) abundance. For miRNA families with multiple gene copy numbers, a single representative miRNA is shown. The analysis of all 145 known miRNAs detected in this study is available in Supplemental Table S3 and Supplemental Methods.


