
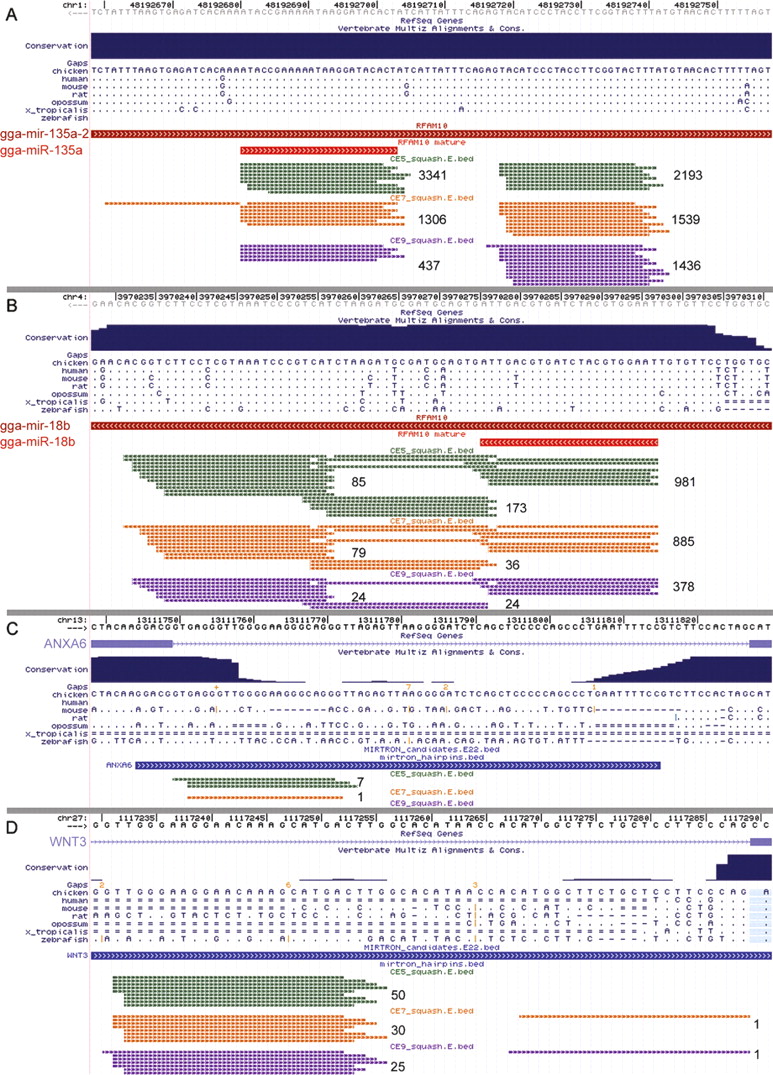
Figure 1.
The figure shows UCSC genome browser screens displaying chicken miRNAs gga-mir-135a-2 (A), gga-mir-18b (B), a mirtron within the ANXA6 gene (C), and an atypical mirtron within the WNT3 gene (D). Sequence tags originating from these loci are shown as thin lines of three different colors representing each of the small RNA libraries: CE5, green; CE7, orange; and CE9, magenta. Numbers to the right of the sequence tag clusters indicate total number of reads originating from this cluster. Arrow directions indicate positive or negative strand of genomic DNA. Identical bases in the multiple sequence alignment are shown as dots.


