
Table 3.
Pearson correlation coefficient of the 400 percentage values, one for each bacterial genome, between each pair of categories in Table 1 (with P-value in parentheses)
Click on table to view larger version.
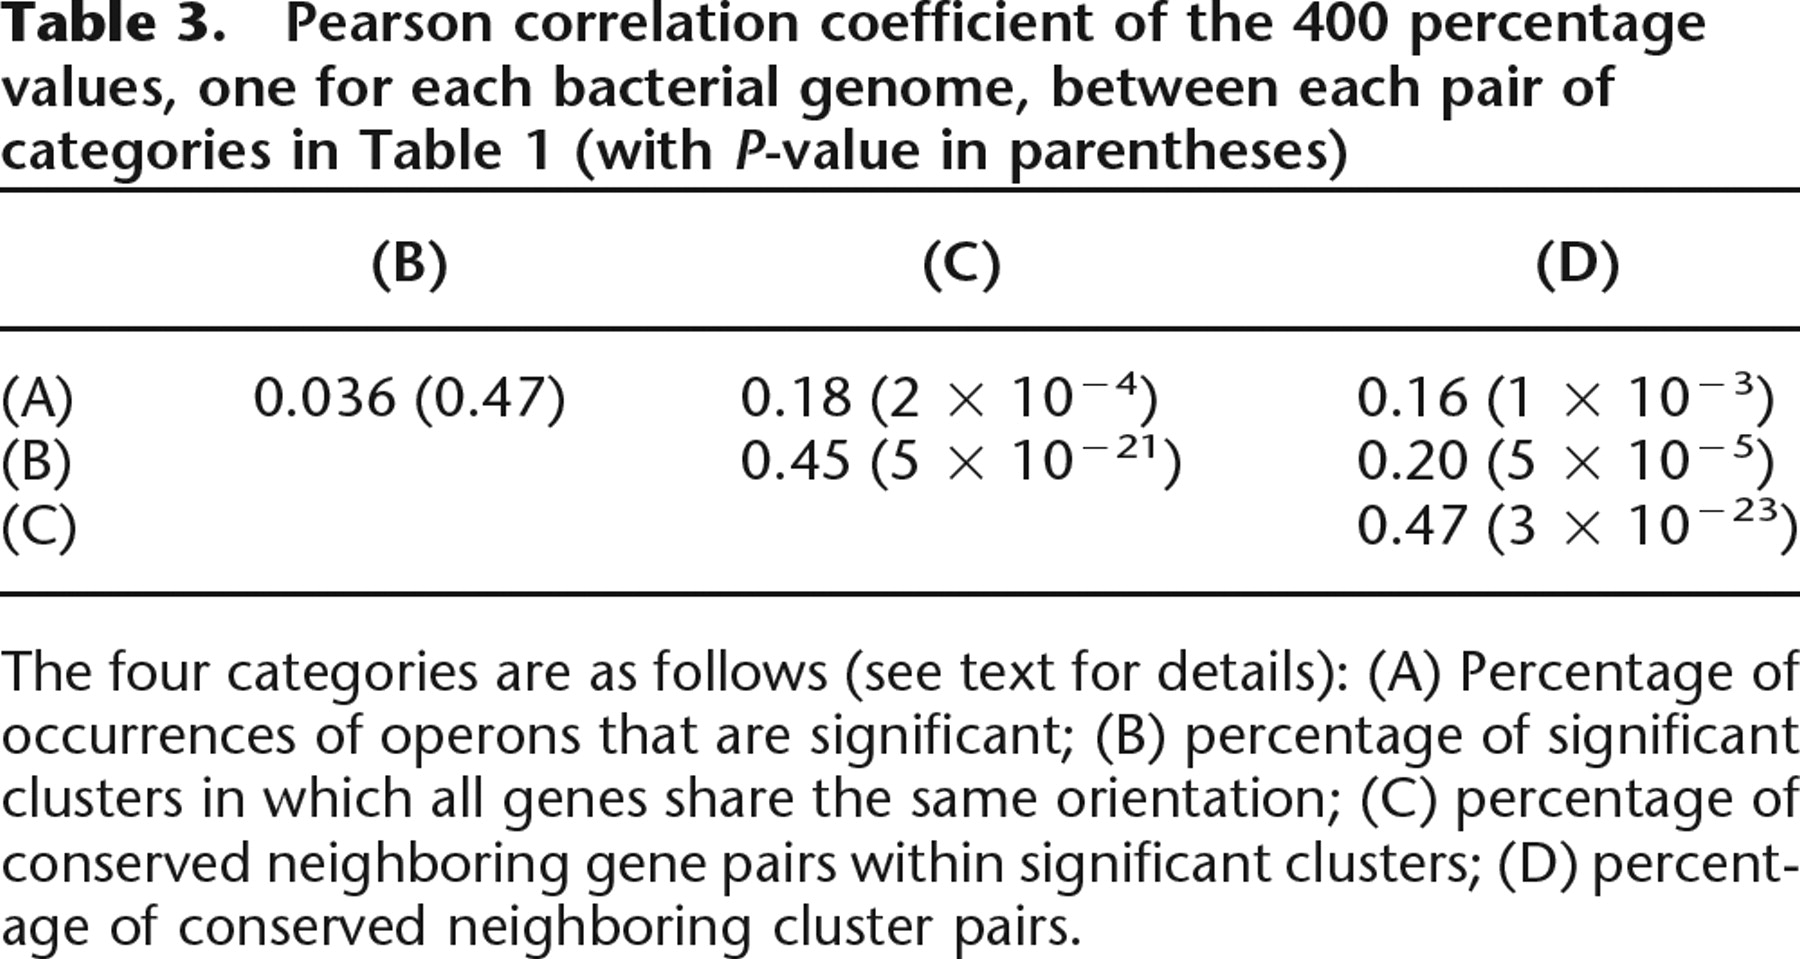
The four categories are as follows (see text for details): (A) Percentage of occurrences of operons that are significant; (B) percentage of significant clusters in which all genes share the same orientation; (C) percentage of conserved neighboring gene pairs within significant clusters; (D) percentage of conserved neighboring cluster pairs.


