
Table 2.
Performance of GCQuery on B. subtilis subsp. subtilis str. 168 over different combinations of the two E-value cutoffs
Click on table to view larger version.
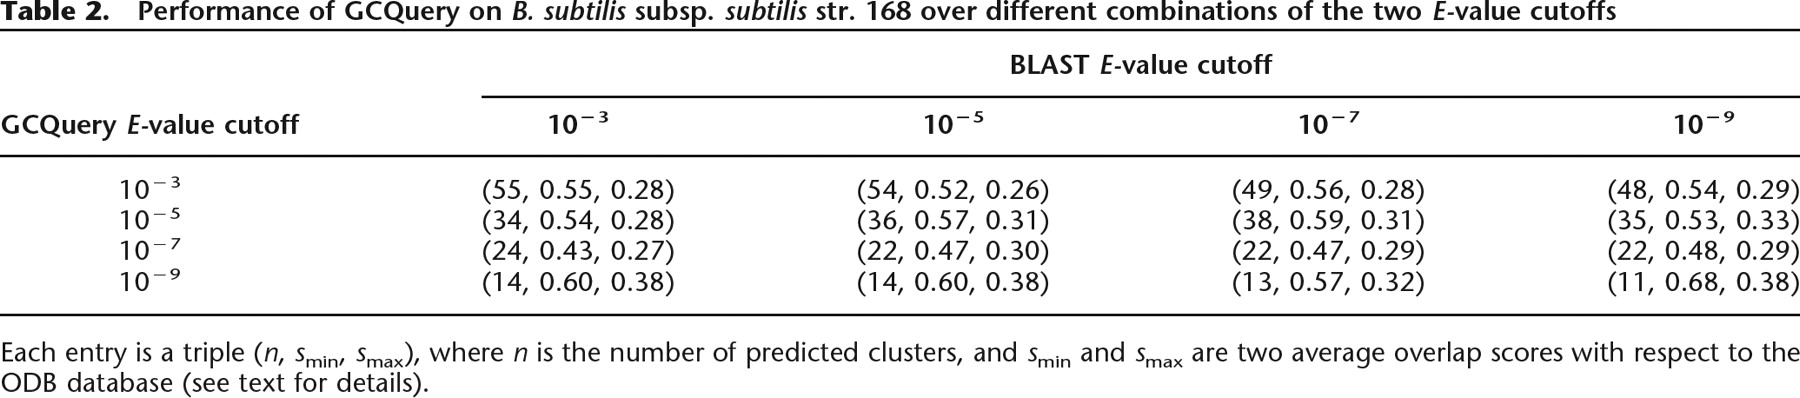
Each entry is a triple (n, smin, smax), where n is the number of predicted clusters, and smin and smax are two average overlap scores with respect to the ODB database (see text for details).


