
Number of genomes in each group and the minimum, maximum, and overall percentage under four categories in each group
Click on table to view larger version.
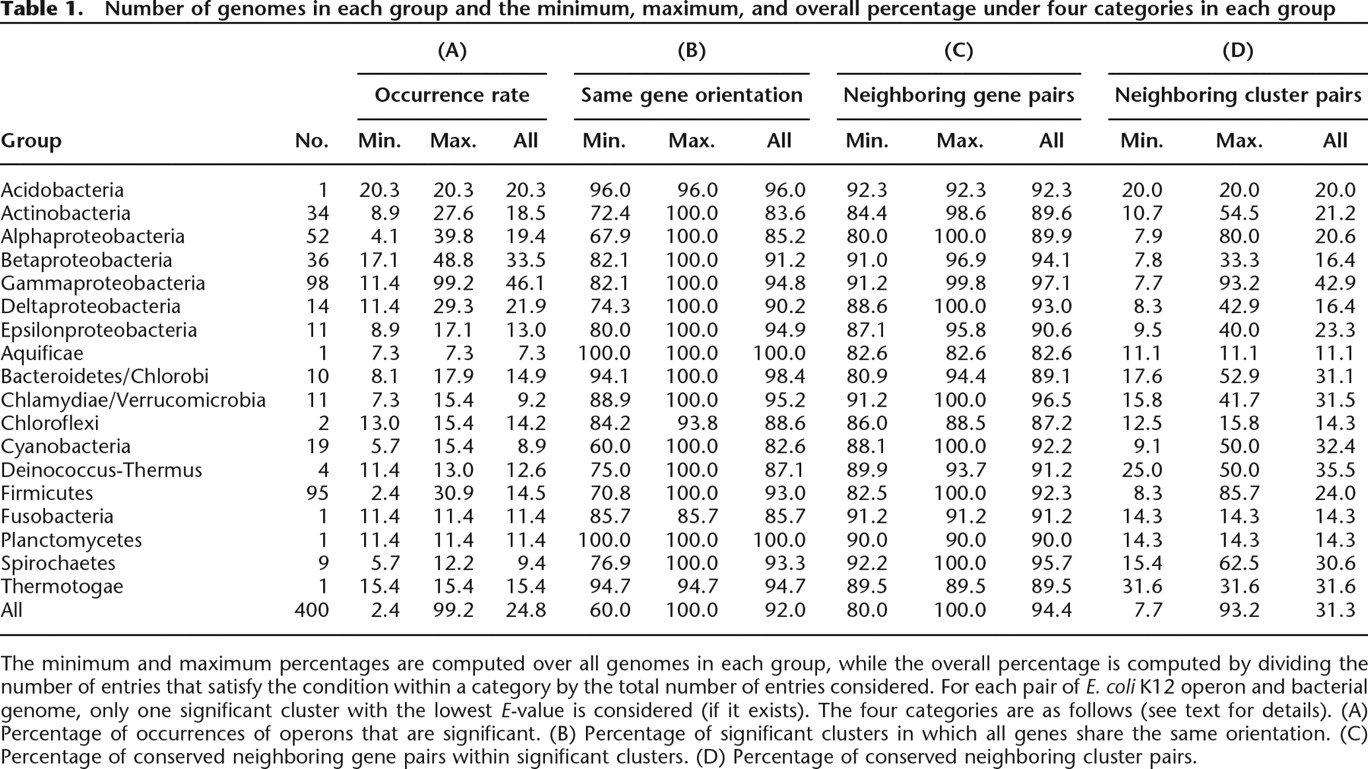
The minimum and maximum percentages are computed over all genomes in each group, while the overall percentage is computed by dividing the number of entries that satisfy the condition within a category by the total number of entries considered. For each pair of E. coli K12 operon and bacterial genome, only one significant cluster with the lowest E-value is considered (if it exists). The four categories are as follows (see text for details). (A) Percentage of occurrences of operons that are significant. (B) Percentage of significant clusters in which all genes share the same orientation. (C) Percentage of conserved neighboring gene pairs within significant clusters. (D) Percentage of conserved neighboring cluster pairs.


