
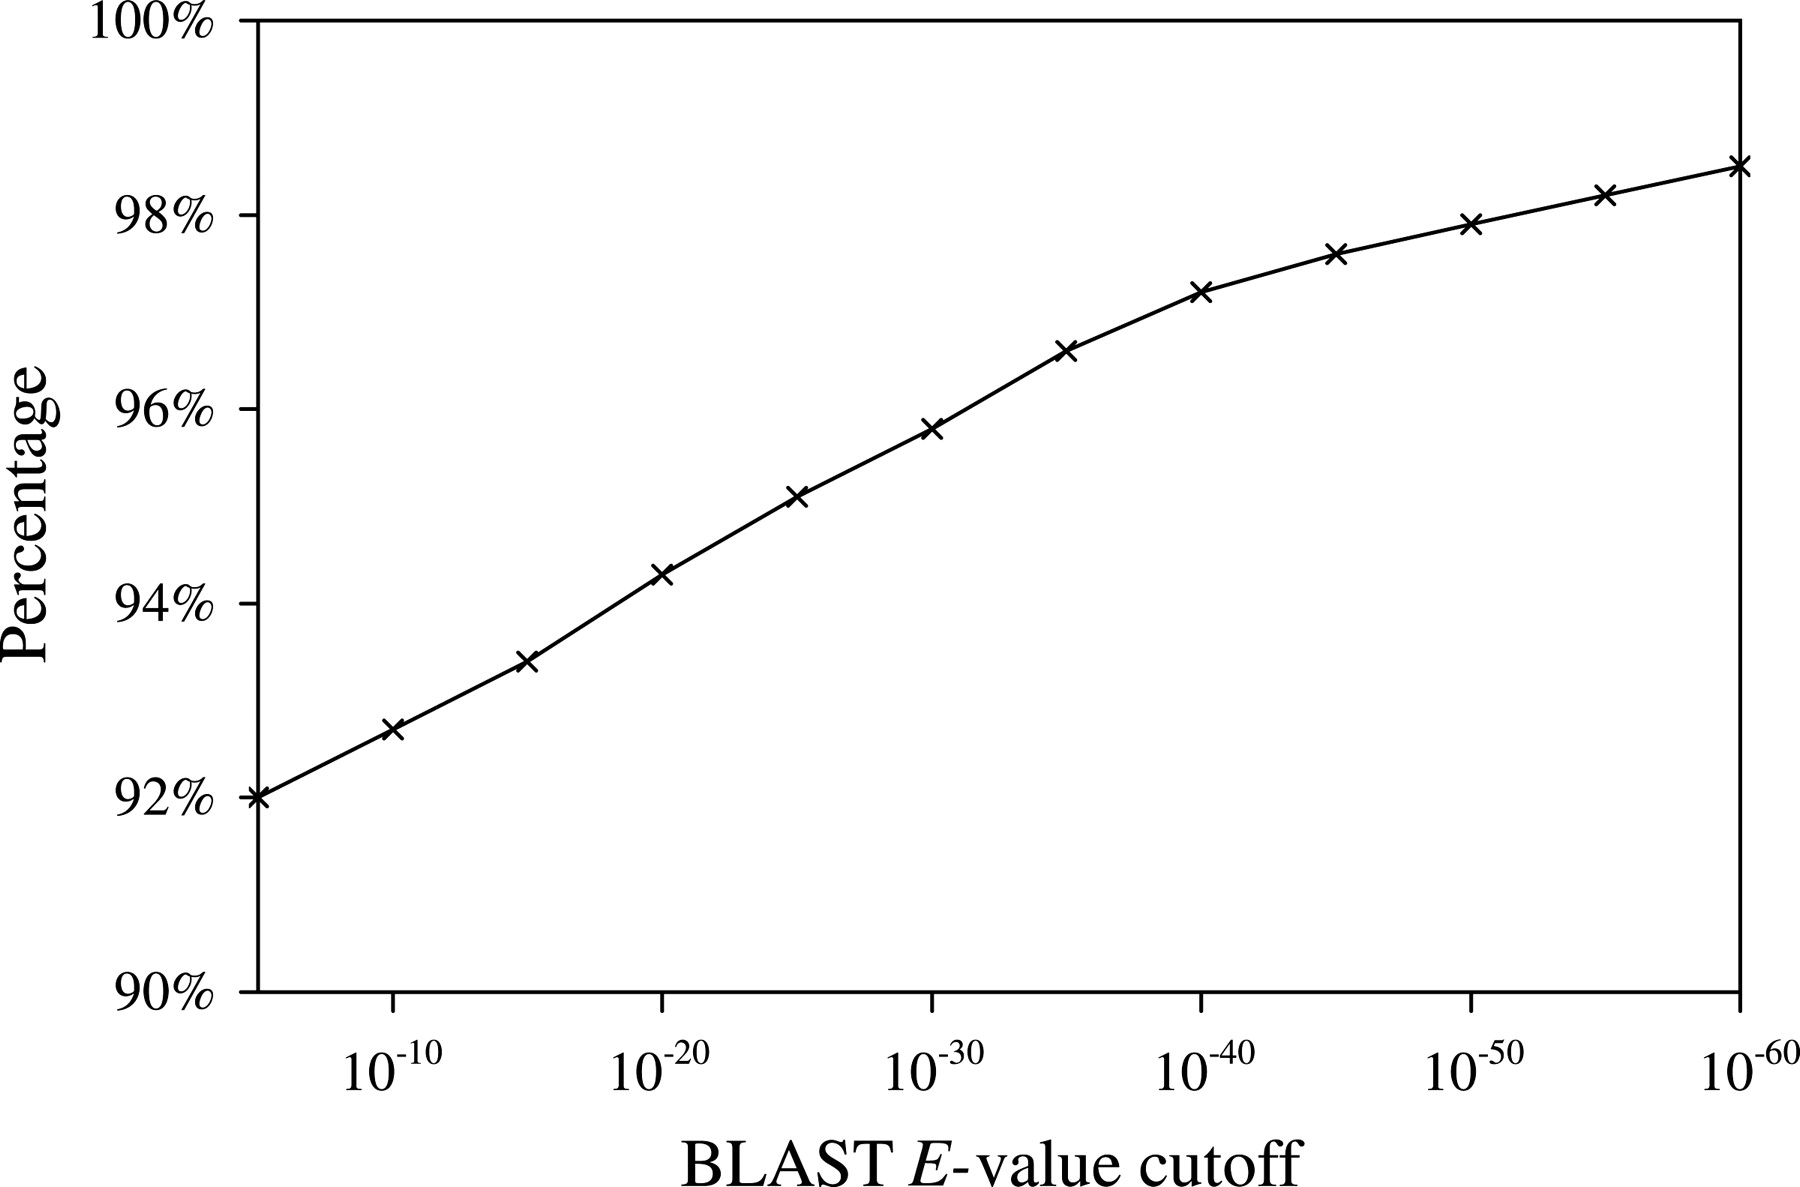
Figure 6.
Percentage of clusters in which all genes share the same orientation for different BLAST E-value cutoffs.
(Downloading may take up to 30 seconds. If the slide opens in your browser, select File -> Save As to save it.)
Click on image to view larger version.
Percentage of clusters in which all genes share the same orientation for different BLAST E-value cutoffs.
 CiteULike
 Delicious
 Digg
Digg Facebook
 Google+
 Reddit
 Twitter
