
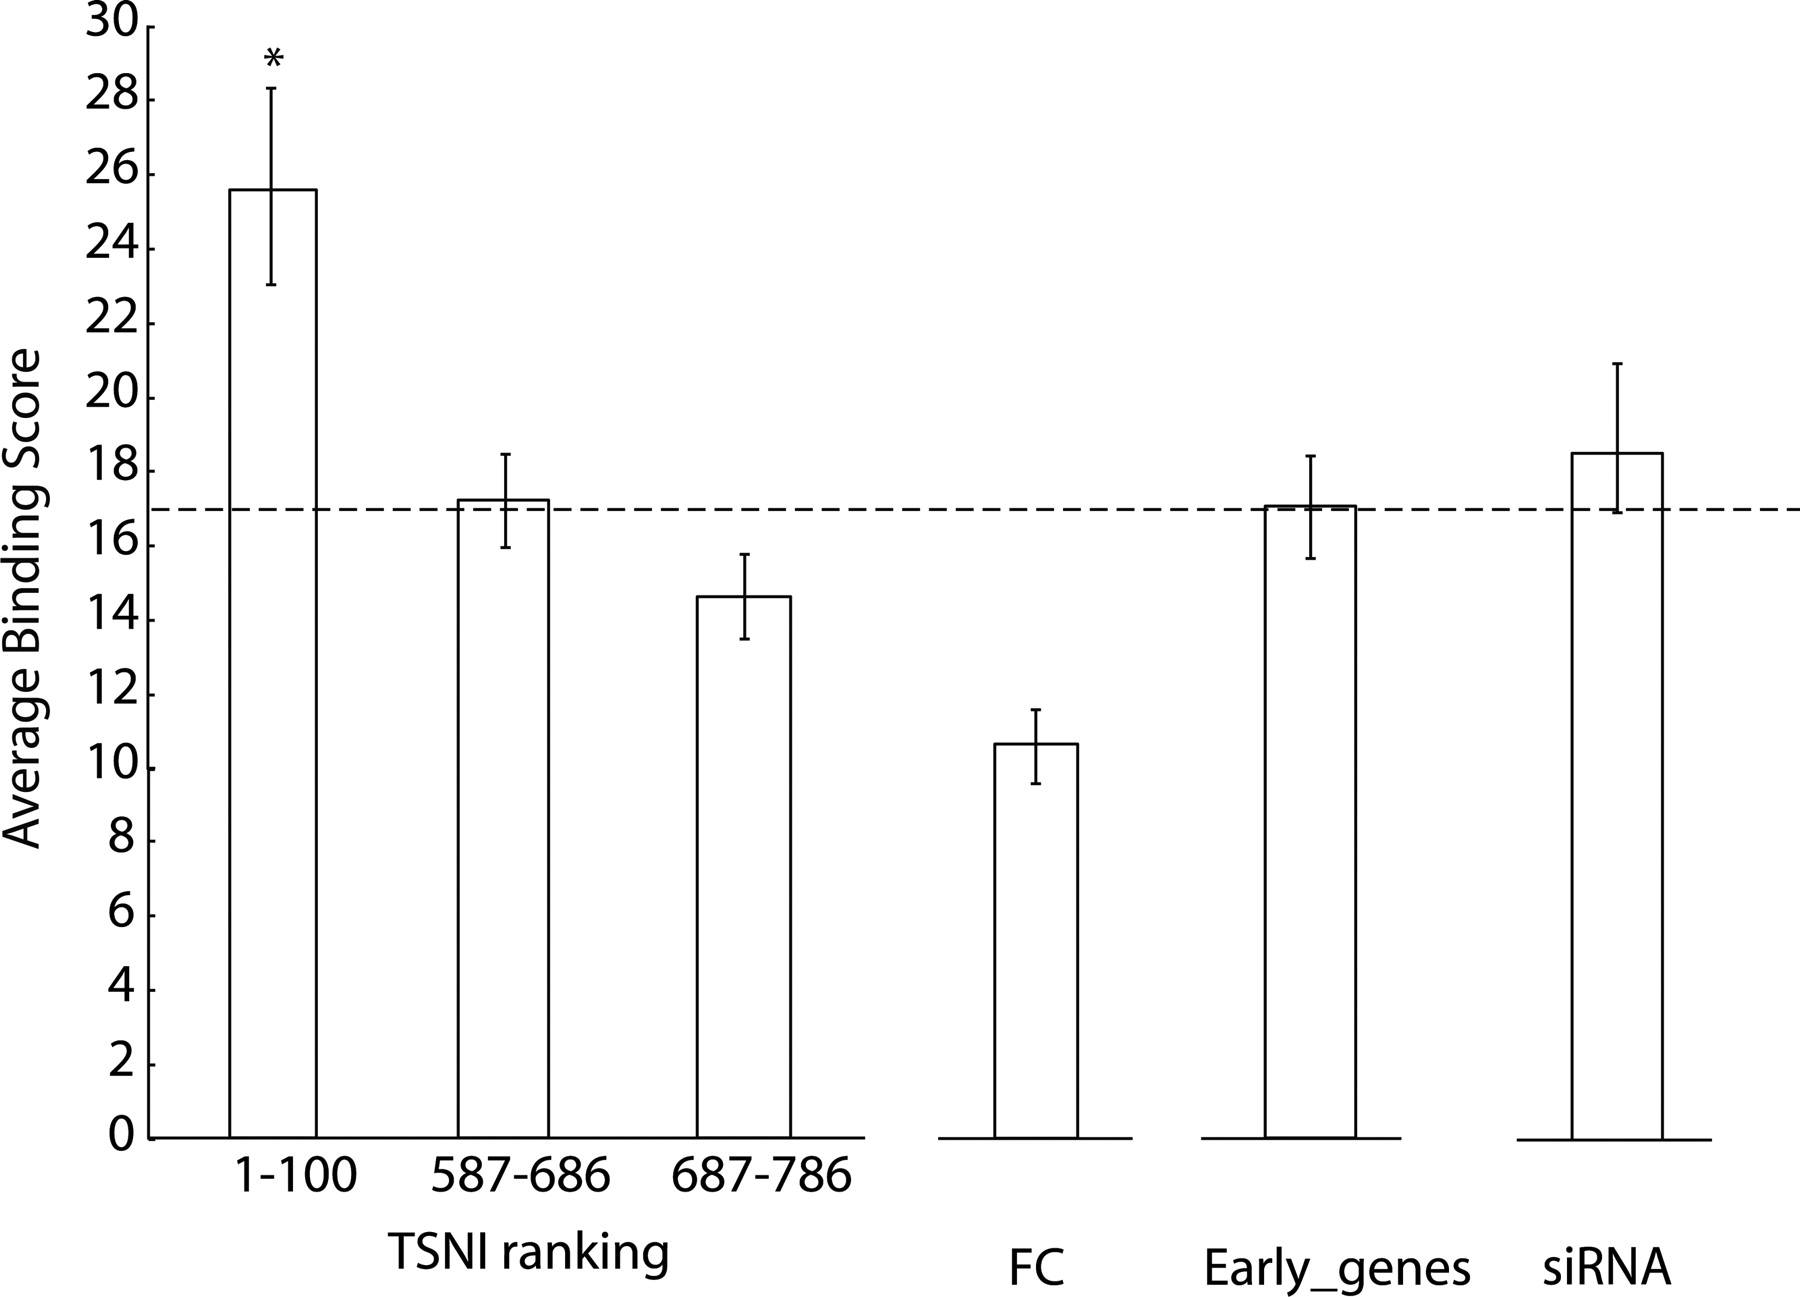
TSNI enriches for TRP63 direct targets. Average TRP63 binding score (BS) of genes associated to the top 100 TSNI-ranked transcripts and to the bottom 200 TSNI ranked transcripts (from rank 587 to rank 786) included on the array as controls. FC is the average BS obtained by ranking genes according to their fold changes following TRP63 induction; Early_genes is obtained by ranking genes according to their time of change upon ΔNp63α activation. siRNA is obtained by ranking genes according to their differential expression following Trp63 knockdown. (Dashed line) Central value of BS for a random selection of 100 genes. Significance is computed as compared with the average BS of a set of 100 transcripts picked at random. *P = 0.02.


