
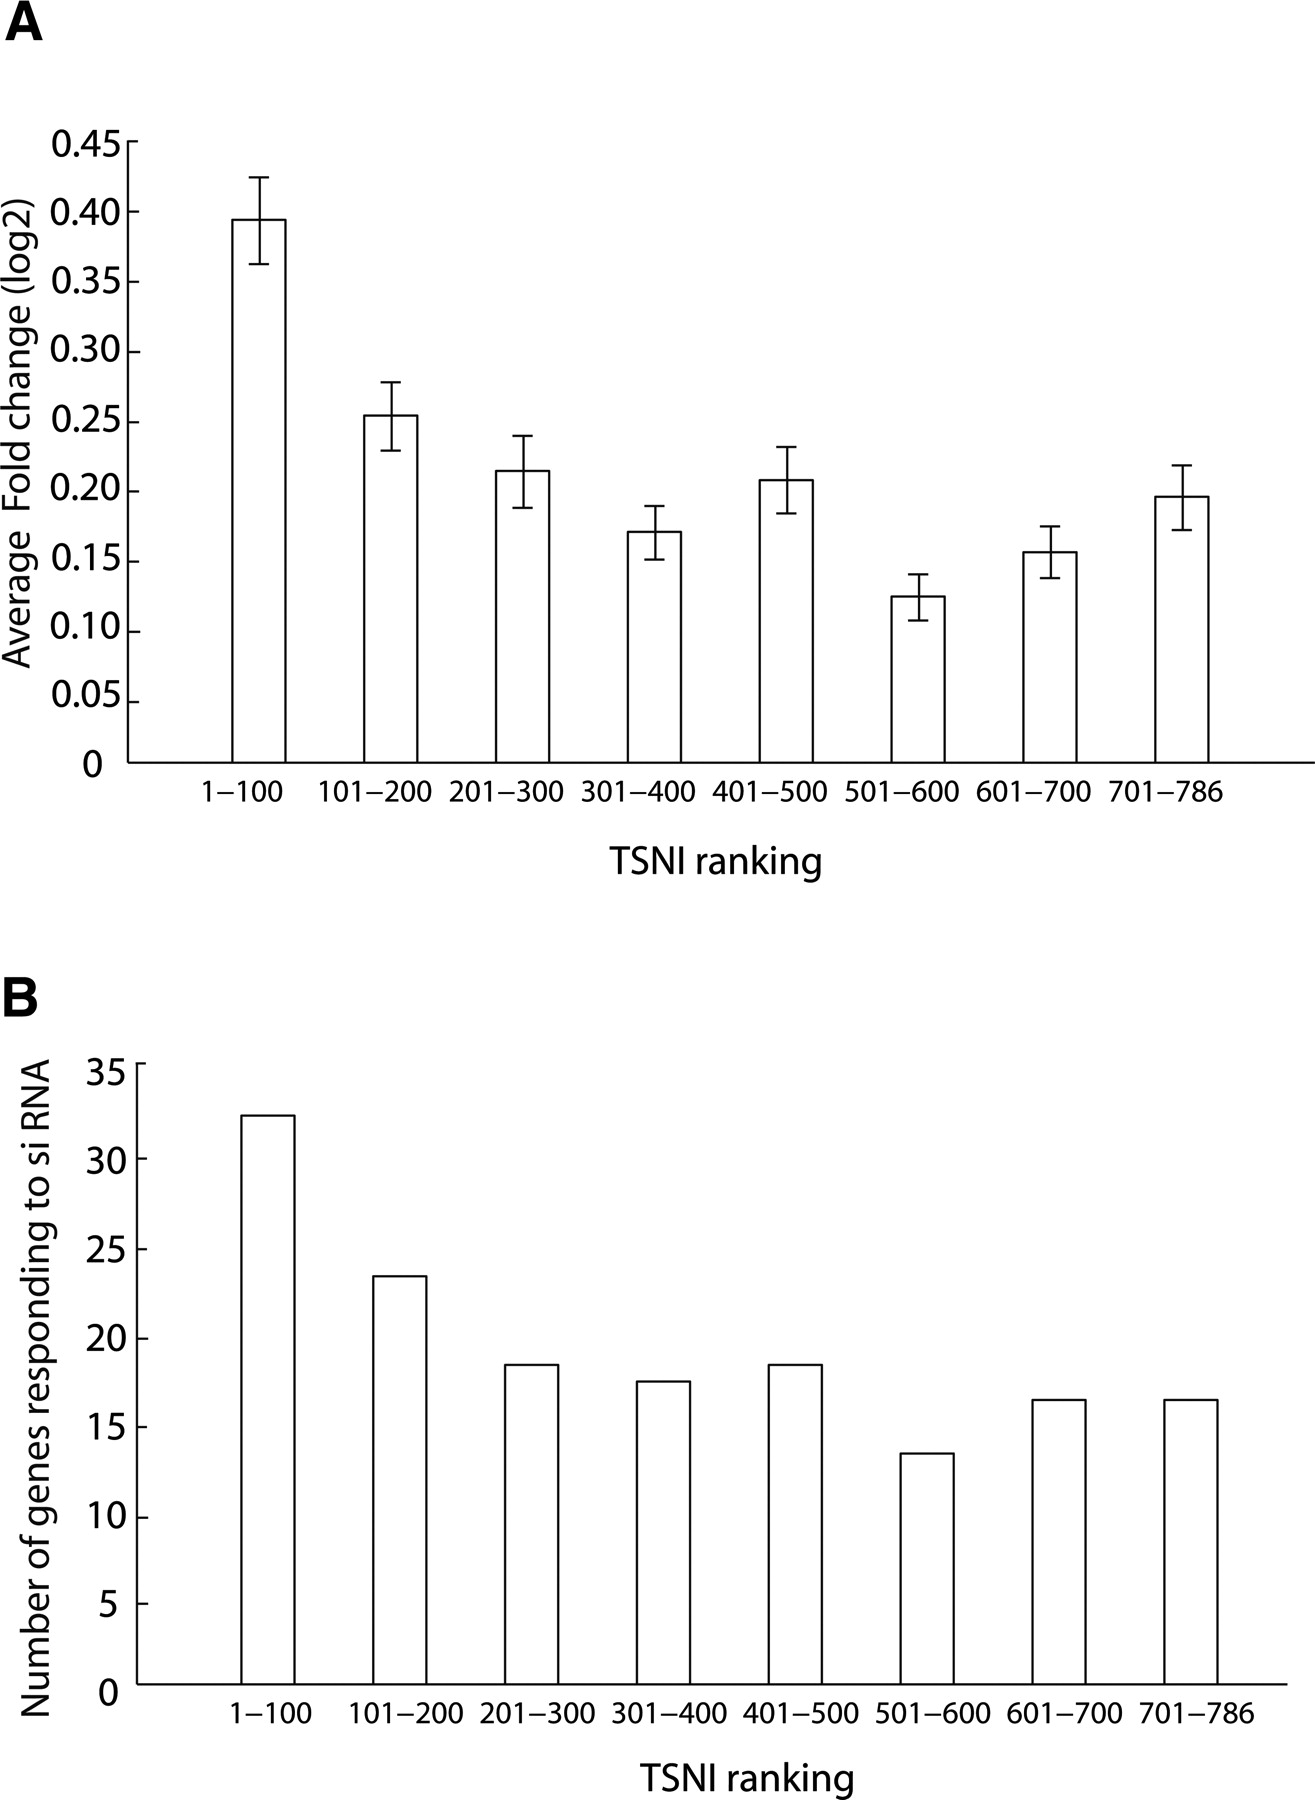
TSNI-predicted TRP63 target genes are enriched for genes responding to Trp63 knockdown. (A) Transcripts were grouped in bins containing 100 transcripts each and indicated on the X-axis (e.g., “1-100” corresponds to the first bin containing genes ranked by TSNI between position 1 and 100). The average fold change in response to Trp63 knockdown of each group of 100 transcripts is computed. Fold change is shown as log2 values. The top 100 TSNI ranked genes changed significantly more (P = 1 × 10⁻⁴) than a group of 100 transcripts picked at random. (B) Number of genes responding to Trp63 knockdown (siRNA) for each group of 100 transcripts. The top 100 TSNI ranked transcripts contain significantly more (P = 0.0001) transcripts that respond to Trp63 knockdown than a group of 100 transcripts picked at random.


