
Sensitivity by polymorphism and sequence type
Click on table to view larger version.
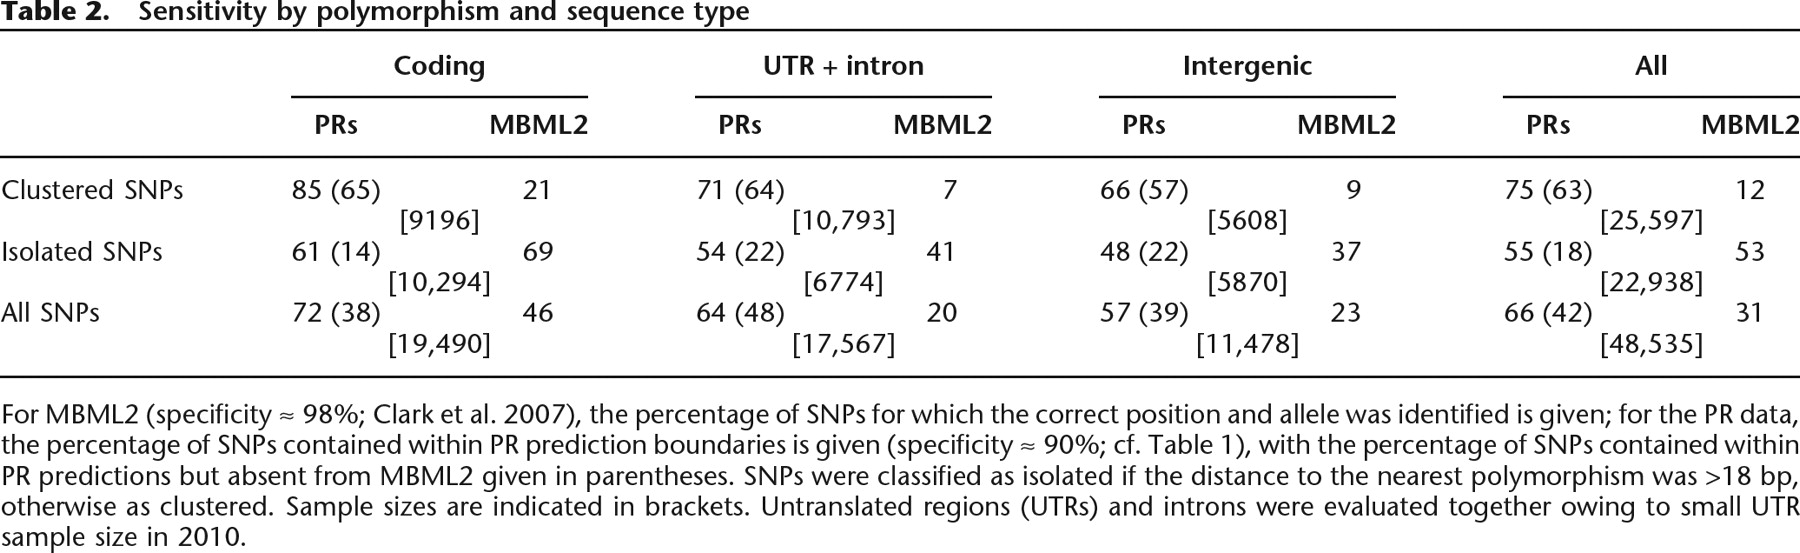
For MBML2 (specificity ≈ 98%; Clark et al. 2007), the percentage of SNPs for which the correct position and allele was identified is given; for the PR data, the percentage of SNPs contained within PR prediction boundaries is given (specificity ≈ 90%; cf. Table 1), with the percentage of SNPs contained within PR predictions but absent from MBML2 given in parentheses. SNPs were classified as isolated if the distance to the nearest polymorphism was >18 bp, otherwise as clustered. Sample sizes are indicated in brackets. Untranslated regions (UTRs) and introns were evaluated together owing to small UTR sample size in 2010.


