
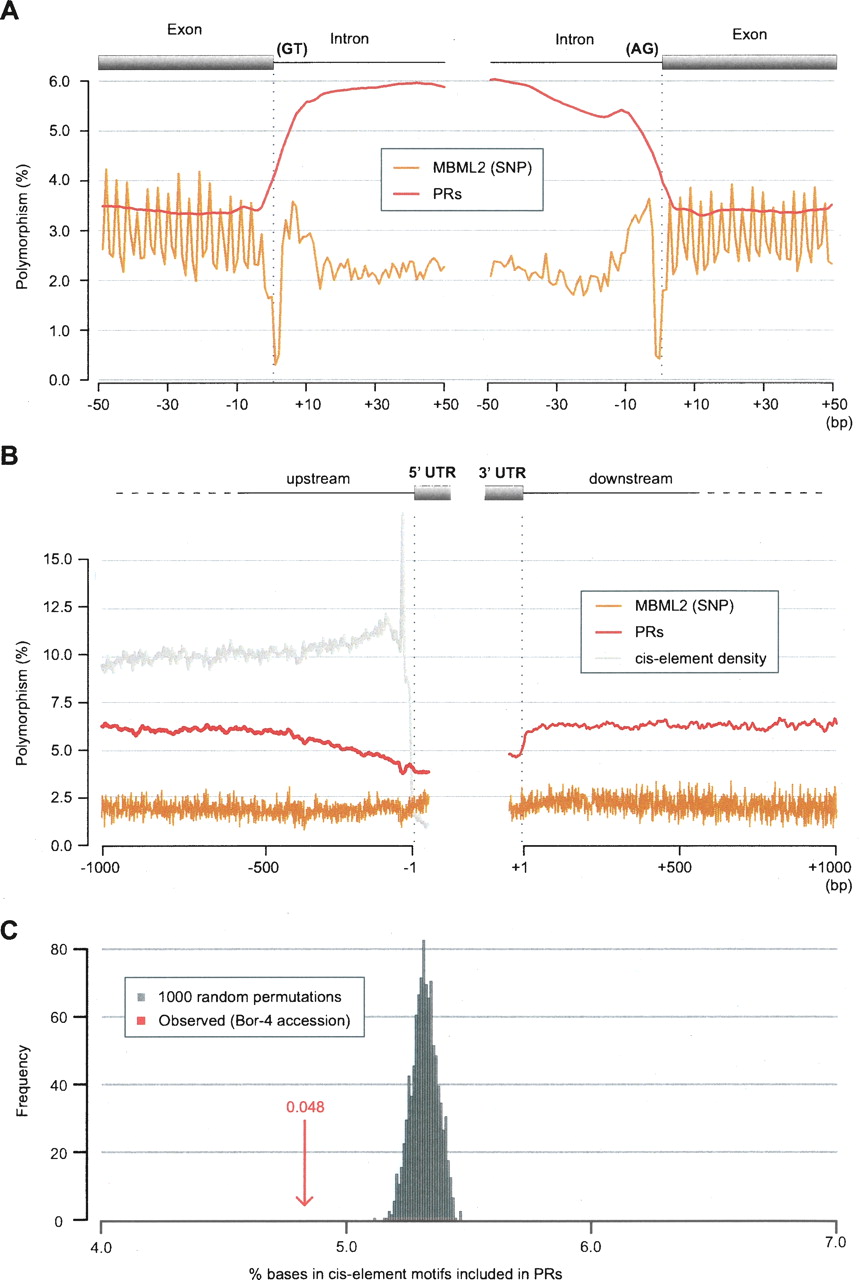
Patterns of polymorphism apparent in PR and SNP data in noncoding regions. (A) Polymorphism near splice donor (left) and splice acceptor (right) sites as averaged over 116,971 splice sites and assessed with both the PR prediction and MBML2 (SNP) data sets (for details of polymorphism estimation, see inset; Supplemental Methods). Relaxed constraint at wobble positions is apparent in the SNP data as sequential peaks in polymorphism with a 3-bp offset (the observed pattern reflects, in part, biased splicing at codon boundaries). SNP polymorphism is lowest at splice sites, and polymorphism estimates with the PR and SNP data diverge for intronic sequences (middle). (B) Comparison of the PR and SNP polymorphism estimates for the 1000 bp located 5′ and 3′ to transcription units for coding genes (averaged across 17,434 genes with annotated 5′ UTRs, and 17,430 genes with annotated 3′ UTRs). The average density of predicted cis-elements for the 5′ region is as shown. A peak immediately 5′ to transcription start sites corresponds to the TATA motif. (C) Percentage overlap of PRs to cis-element motifs mapped to the A. thaliana genome for 9599 upstream regions for Bor-4 (red arrow) (for overlap in other accessions, see Supplemental Fig. S8). The overlap expected by chance was established by permuting PRs and upstream regions 1000 times (gray shading; see Supplemental Methods).


