
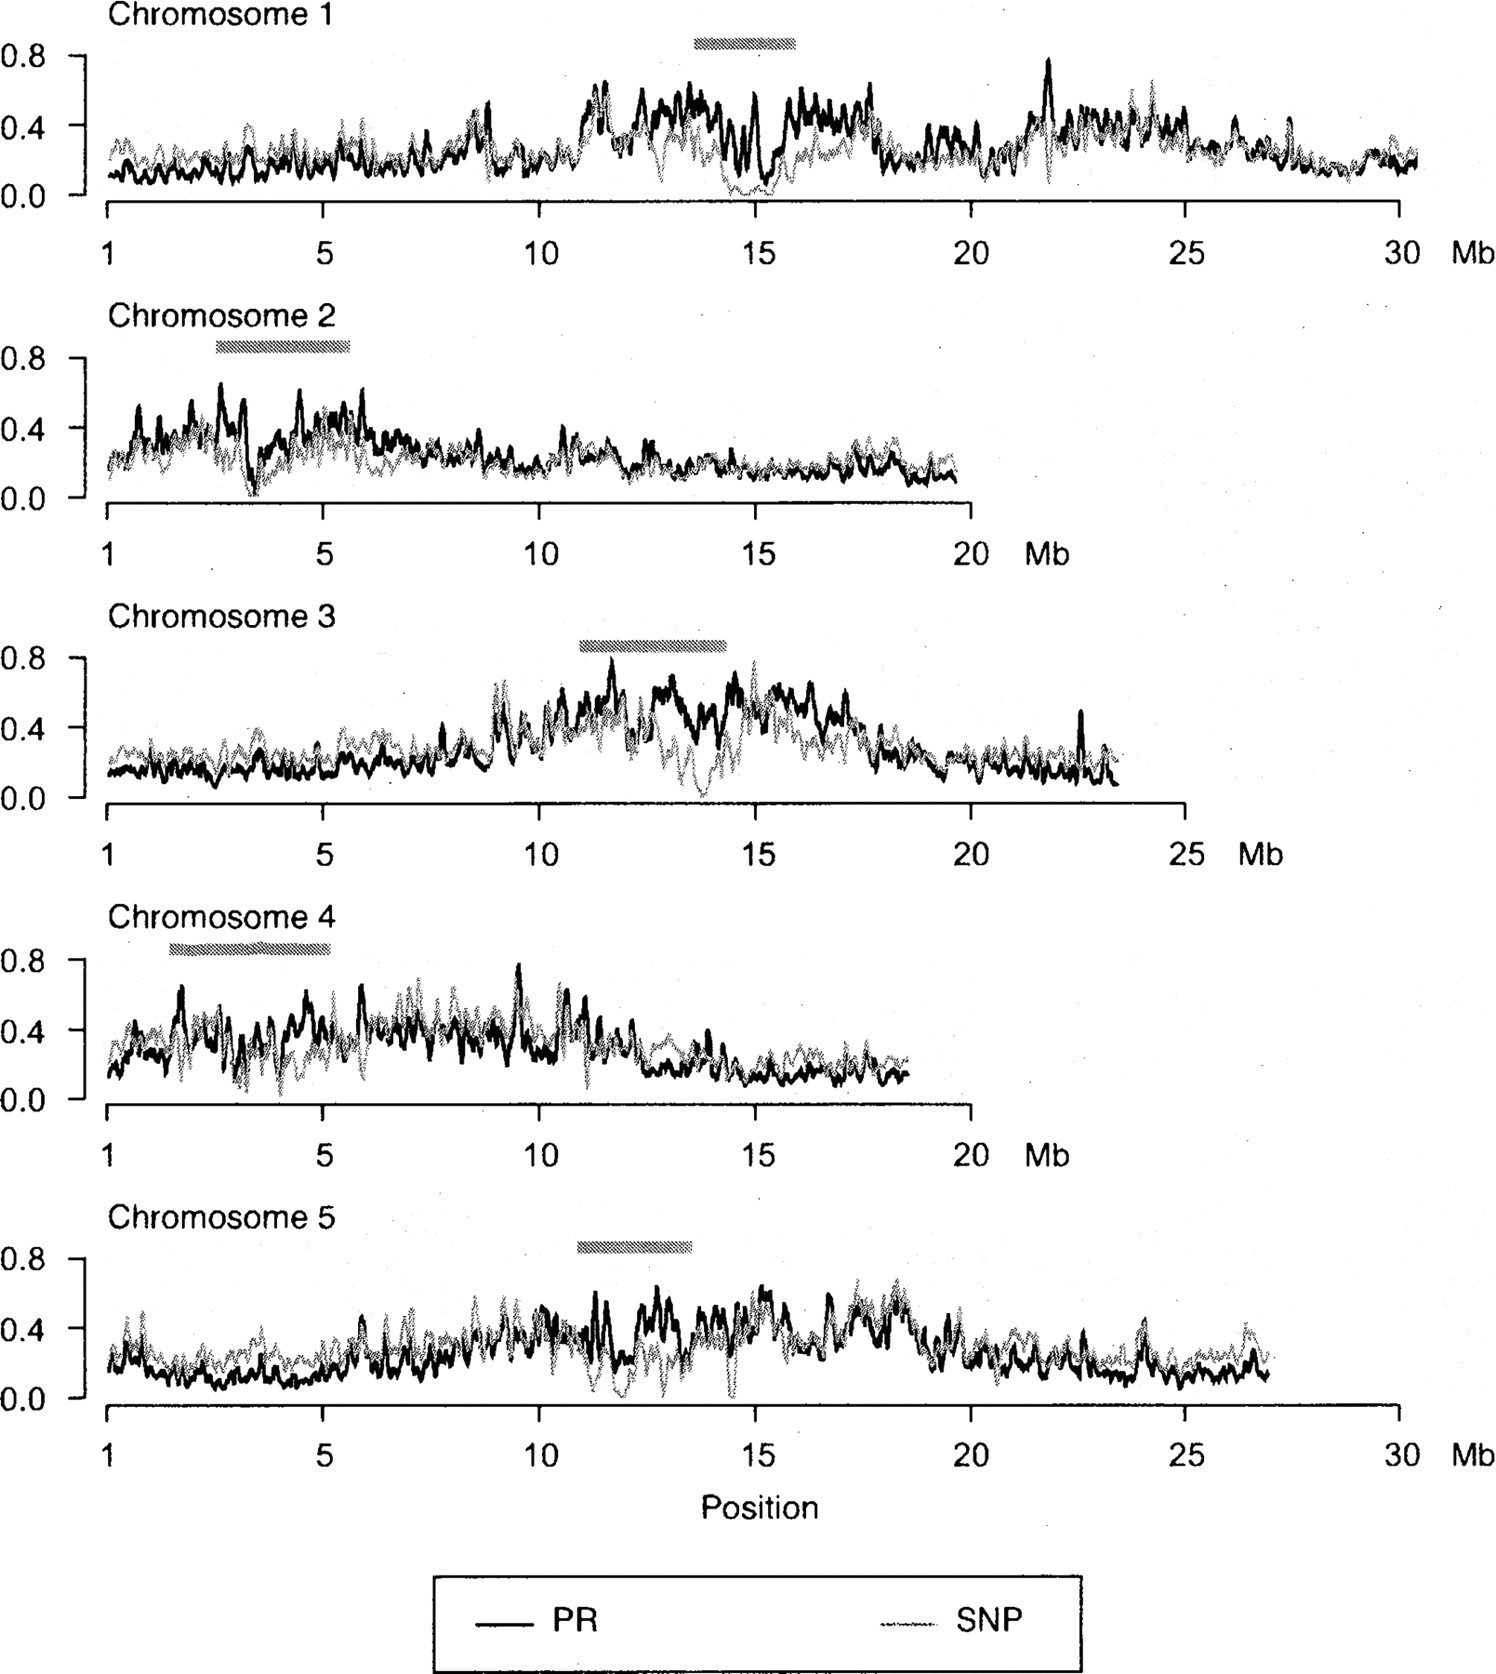
Figure 5.
Genome-wide patterns of polymorphism in PRs and MBML2 SNPs. A sliding window of 100 kb was used, with values for every 10,000th position plotted. The Y-axis displays the fraction of bp in each window included within PRs nonredundantly over all accessions (black line), and the two measures of polymorphism are broadly correlated (Supplemental Fig. S7). To facilitate visualization, the analogous measure for the SNP data was multiplied by 50 (gray line). Thick gray bars indicate the approximate positions of centromeres as defined by repeat content in an earlier study (Clark et al. 2007).


