
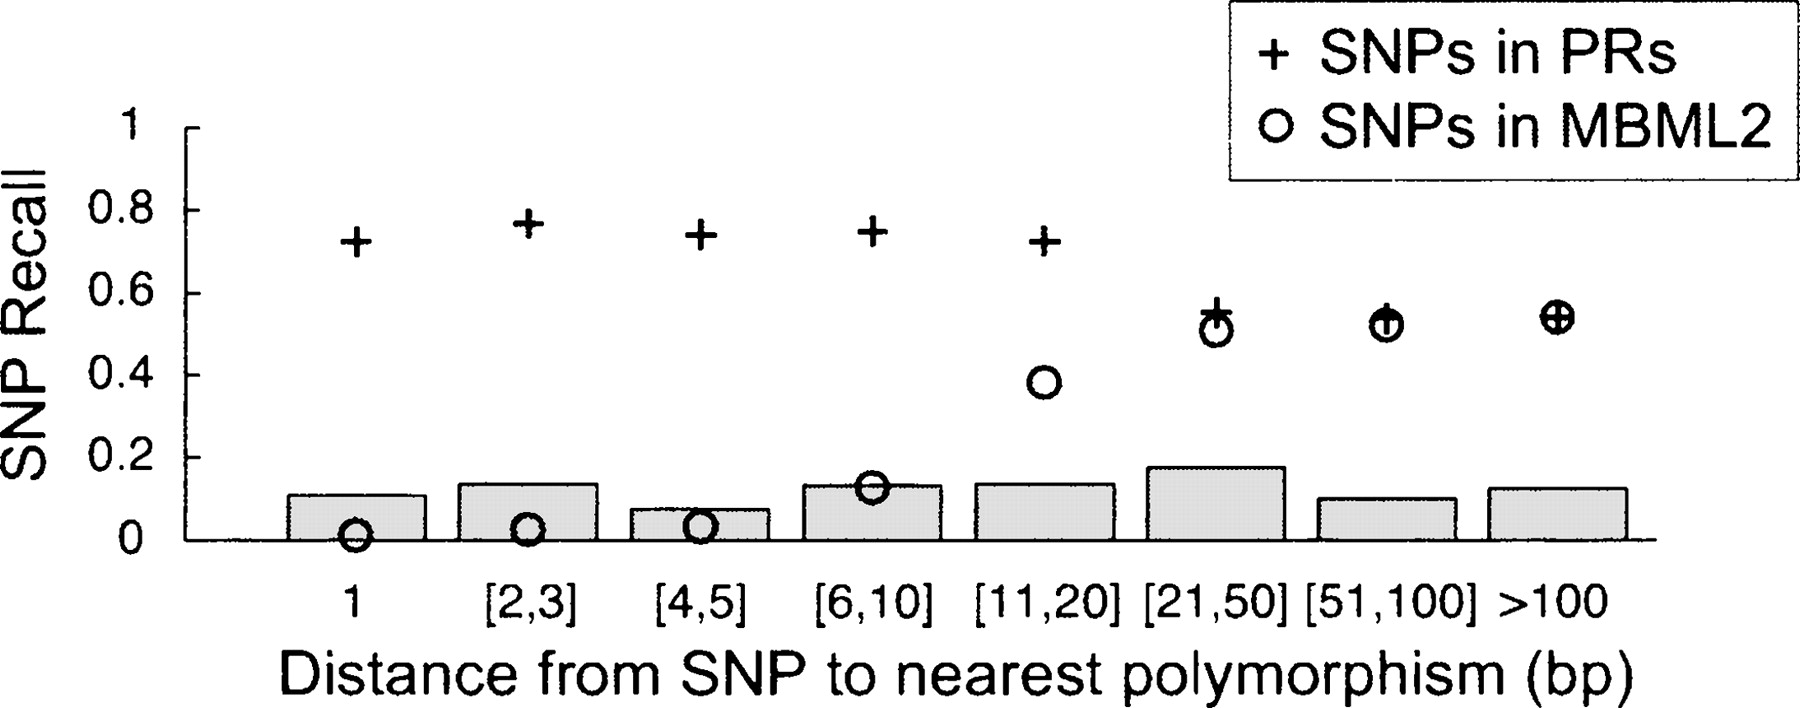
Figure 3.
Dependency of SNP sensitivity on distance between polymorphisms by detection method. SNPs were partitioned according to the distance to the nearest polymorphism. The frequency of SNPs in each distance bin (X-axis) is shown as bars. Sensitivity rates per distance category are given for MBML2 SNP calls (circles) and inclusion within PR prediction boundaries (crosses).


