
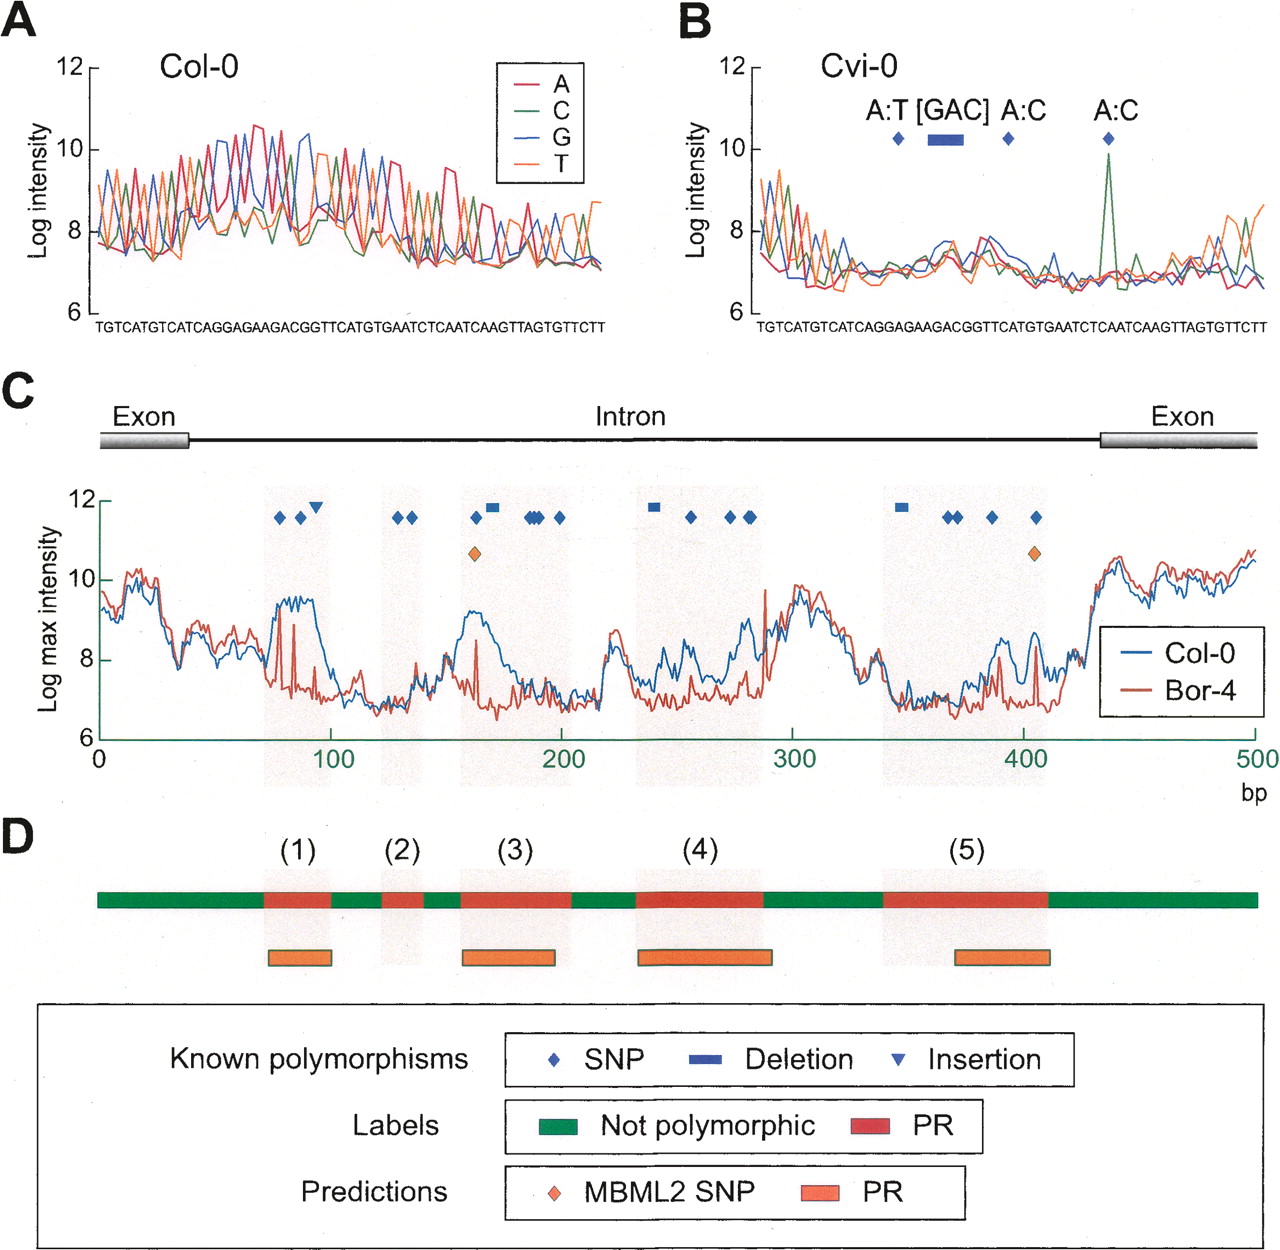
Effect of polymorphisms on hybridization patterns, labels for the mPPR algorithm, and polymorphic predictions. (A) Log2 intensities for oligonucleotides in a 56-bp tiling path (chromosome 4, positions 8,375,747–8,375,802) for the reference Col-0 accession. Intensities for each sequence (see inset) are given and are averages for the forward and reverse strand features tiled on the arrays (see Methods). (B) Corresponding data from accession Cvi-0 for which three SNPs and a 3-bp deletion are present relative to the tiled Col-0 reference sequence. Intensities are suppressed flanking an isolated SNP (right), where the SNP probe shows a clear peak, and intensities for all probes are reduced for the cluster of three polymorphisms, including the deletion (left center). (C) Log2 intensities for the maximally hybridizing oligonucleotide at each tiled position are shown for Col-0 and Bor-4 (see inset) for a particularly challenging sequence fragment in 2010 (chromosome 3, positions 10,245,203–10,245,702; gene AT3G27660). Hybridization properties for much of the region are poor, as reflected by the low intensity values for the perfect match Col-0 reference sequence. Known (2010) and predicted polymorphisms (MBML2) for Bor-4 are as indicated. Only two of the 21 known Bor-4 polymorphisms (17 of which are SNPs) were predicted in MBML2. (D) The corresponding polymorphic region (PR) label sequence for Bor-4 and resulting PR predictions (color coding is as shown at bottom). Light gray shading that extends across panels C and D corresponds to PR labels (red). Plotted data are from Nordborg et al. (2005) and Clark et al. (2007).


