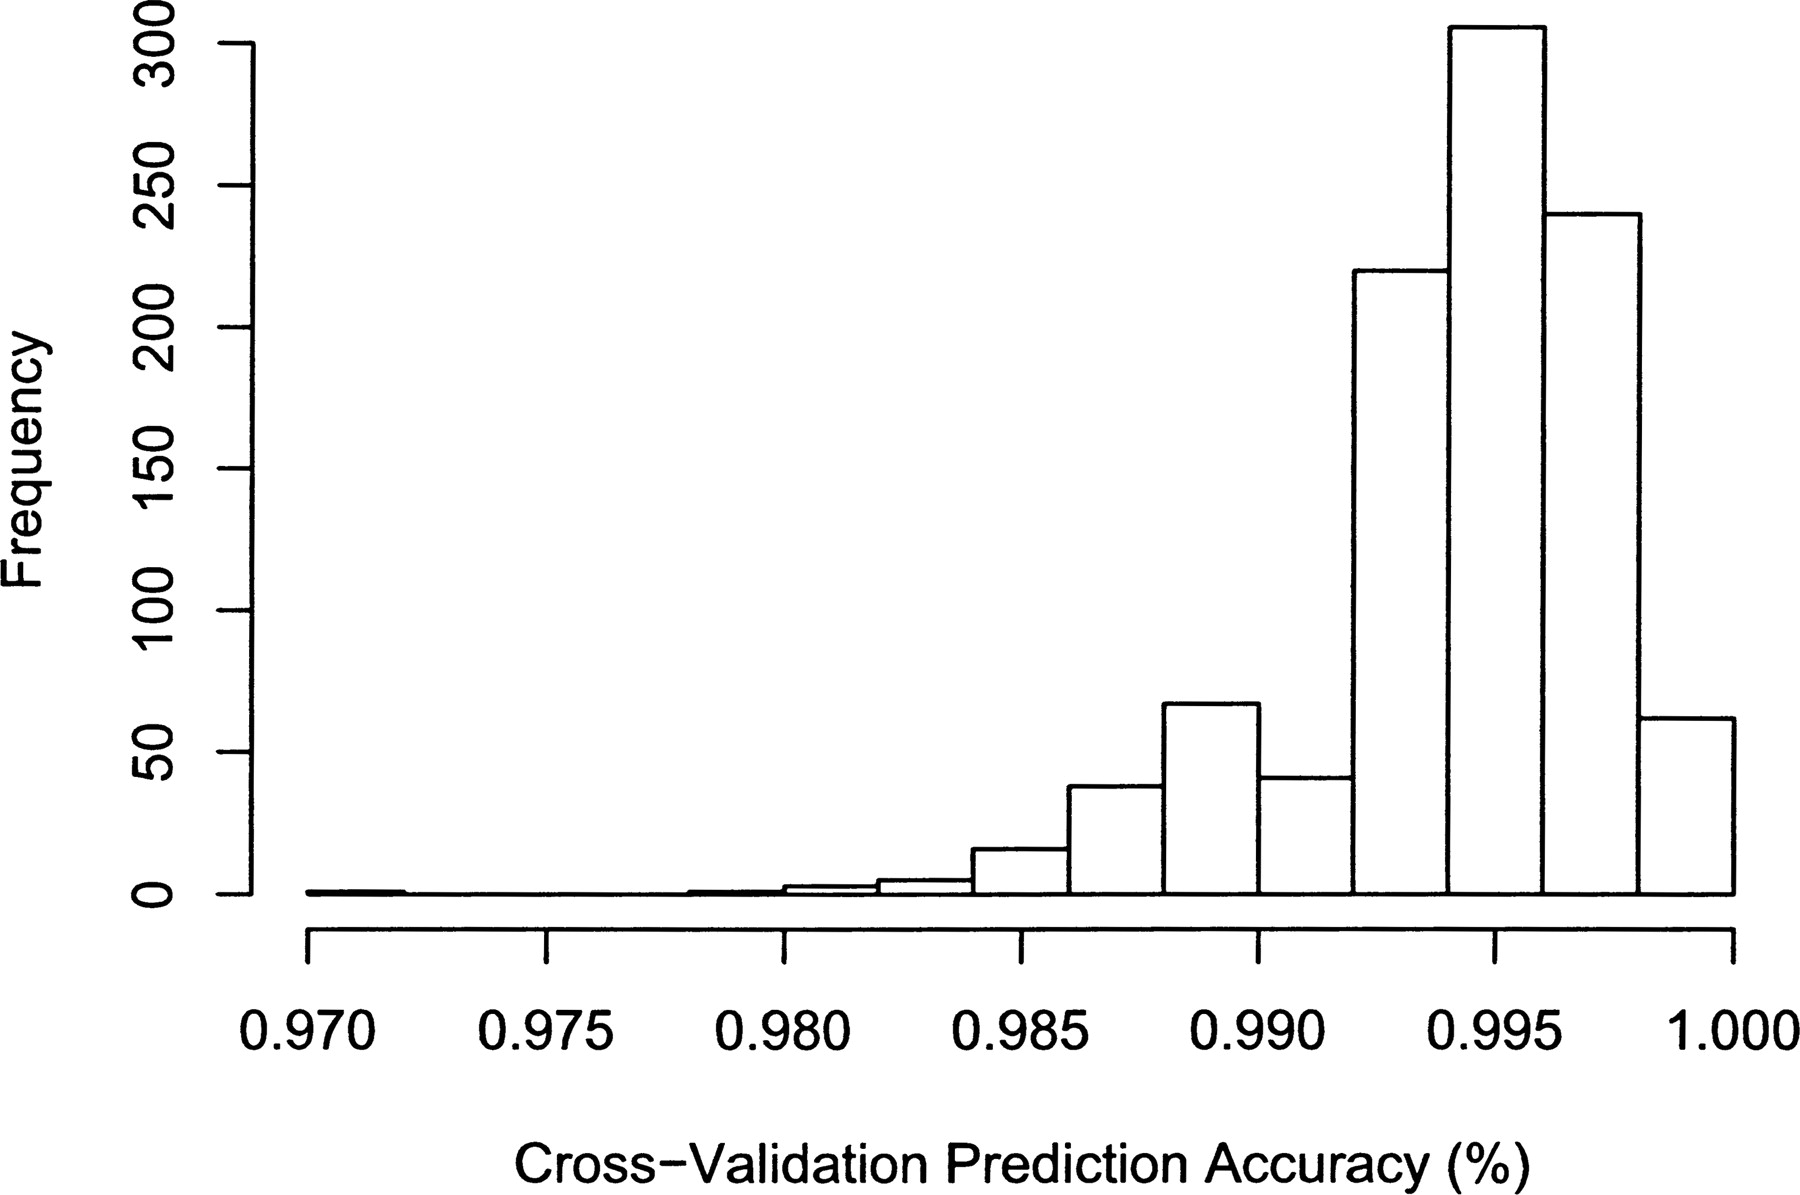
Power and SNP tagging in whole mitochondrial genome association studies

(Downloading may take up to 30 seconds. If the slide opens in your browser, select File -> Save As to save it.)

Click on image to view larger version.

Figure 5.
Figure 5.

Distribution of haplogroup prediction accuracy as determined using bootstrap cross-validation of the linear discriminant function analysis on sequences from the common European haplogroups in mtDB.

This Article

  1. Genome Res. 18: 911-917

Preprint Server