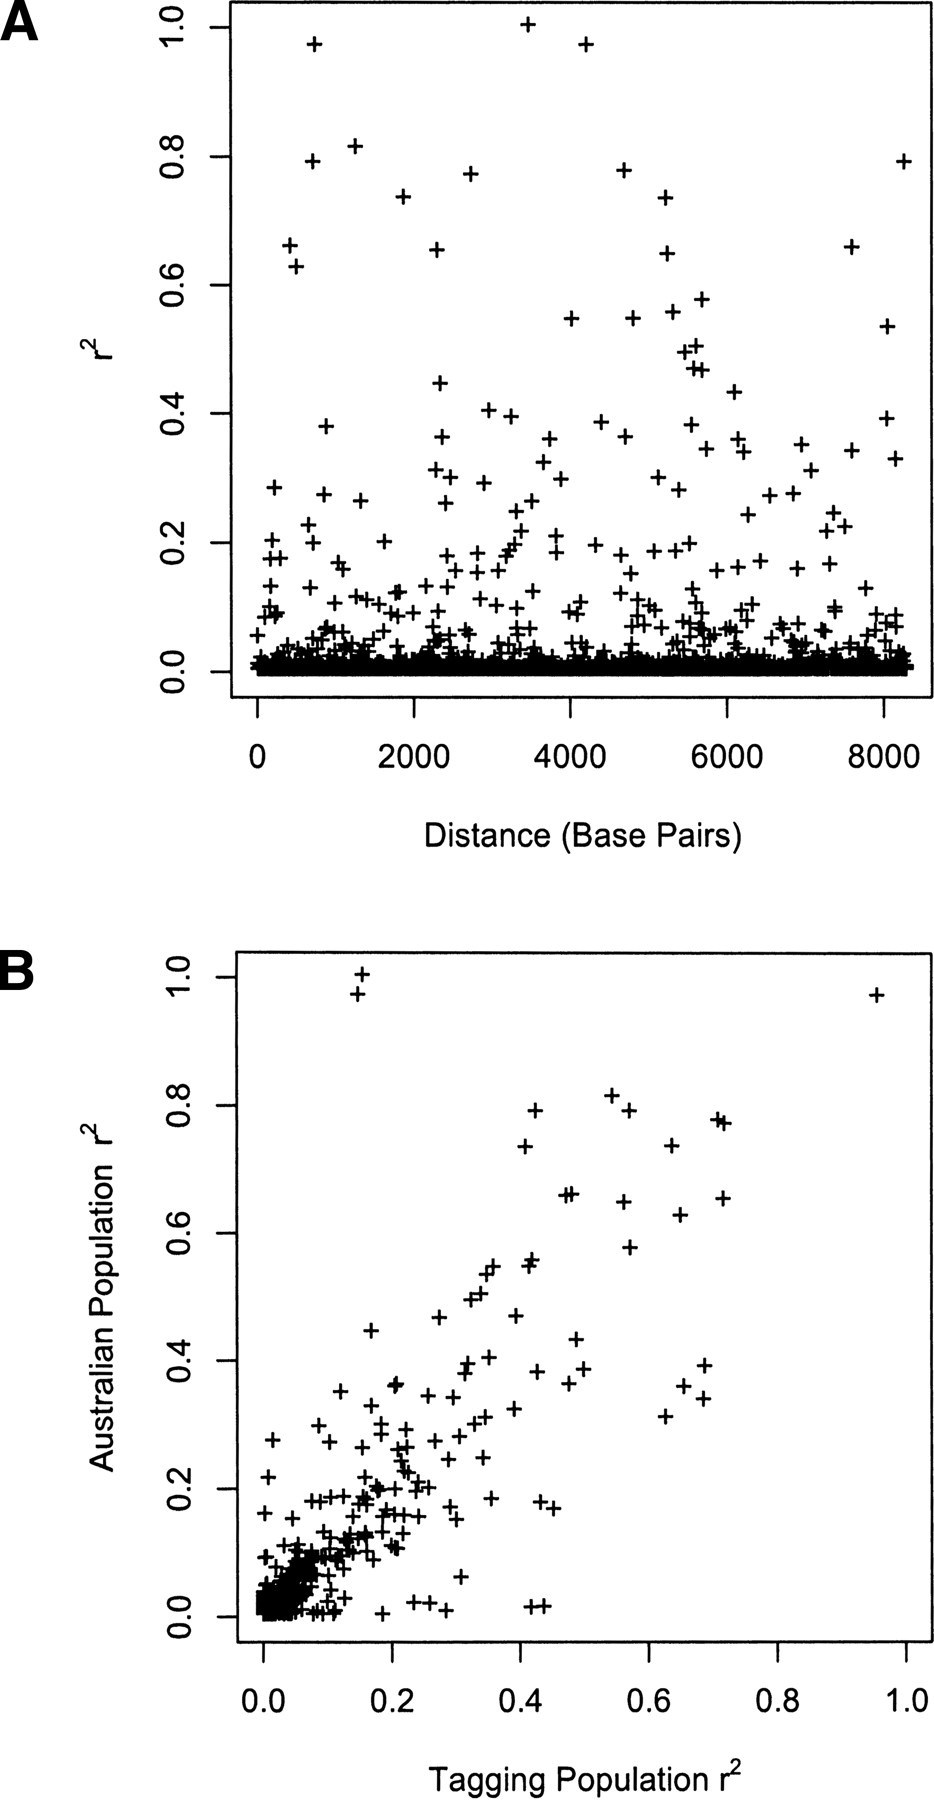
Power and SNP tagging in whole mitochondrial genome association studies

(Downloading may take up to 30 seconds. If the slide opens in your browser, select File -> Save As to save it.)

Click on image to view larger version.

Figure 4.
Figure 4.

Linkage disequilibrium between mitochondrial SNPs in the Australian population. (A) Distribution of linkage disequilibrium with distance. (B) Comparison of LD in the Australian and tagging populations.

This Article

  1. Genome Res. 18: 911-917

Preprint Server