
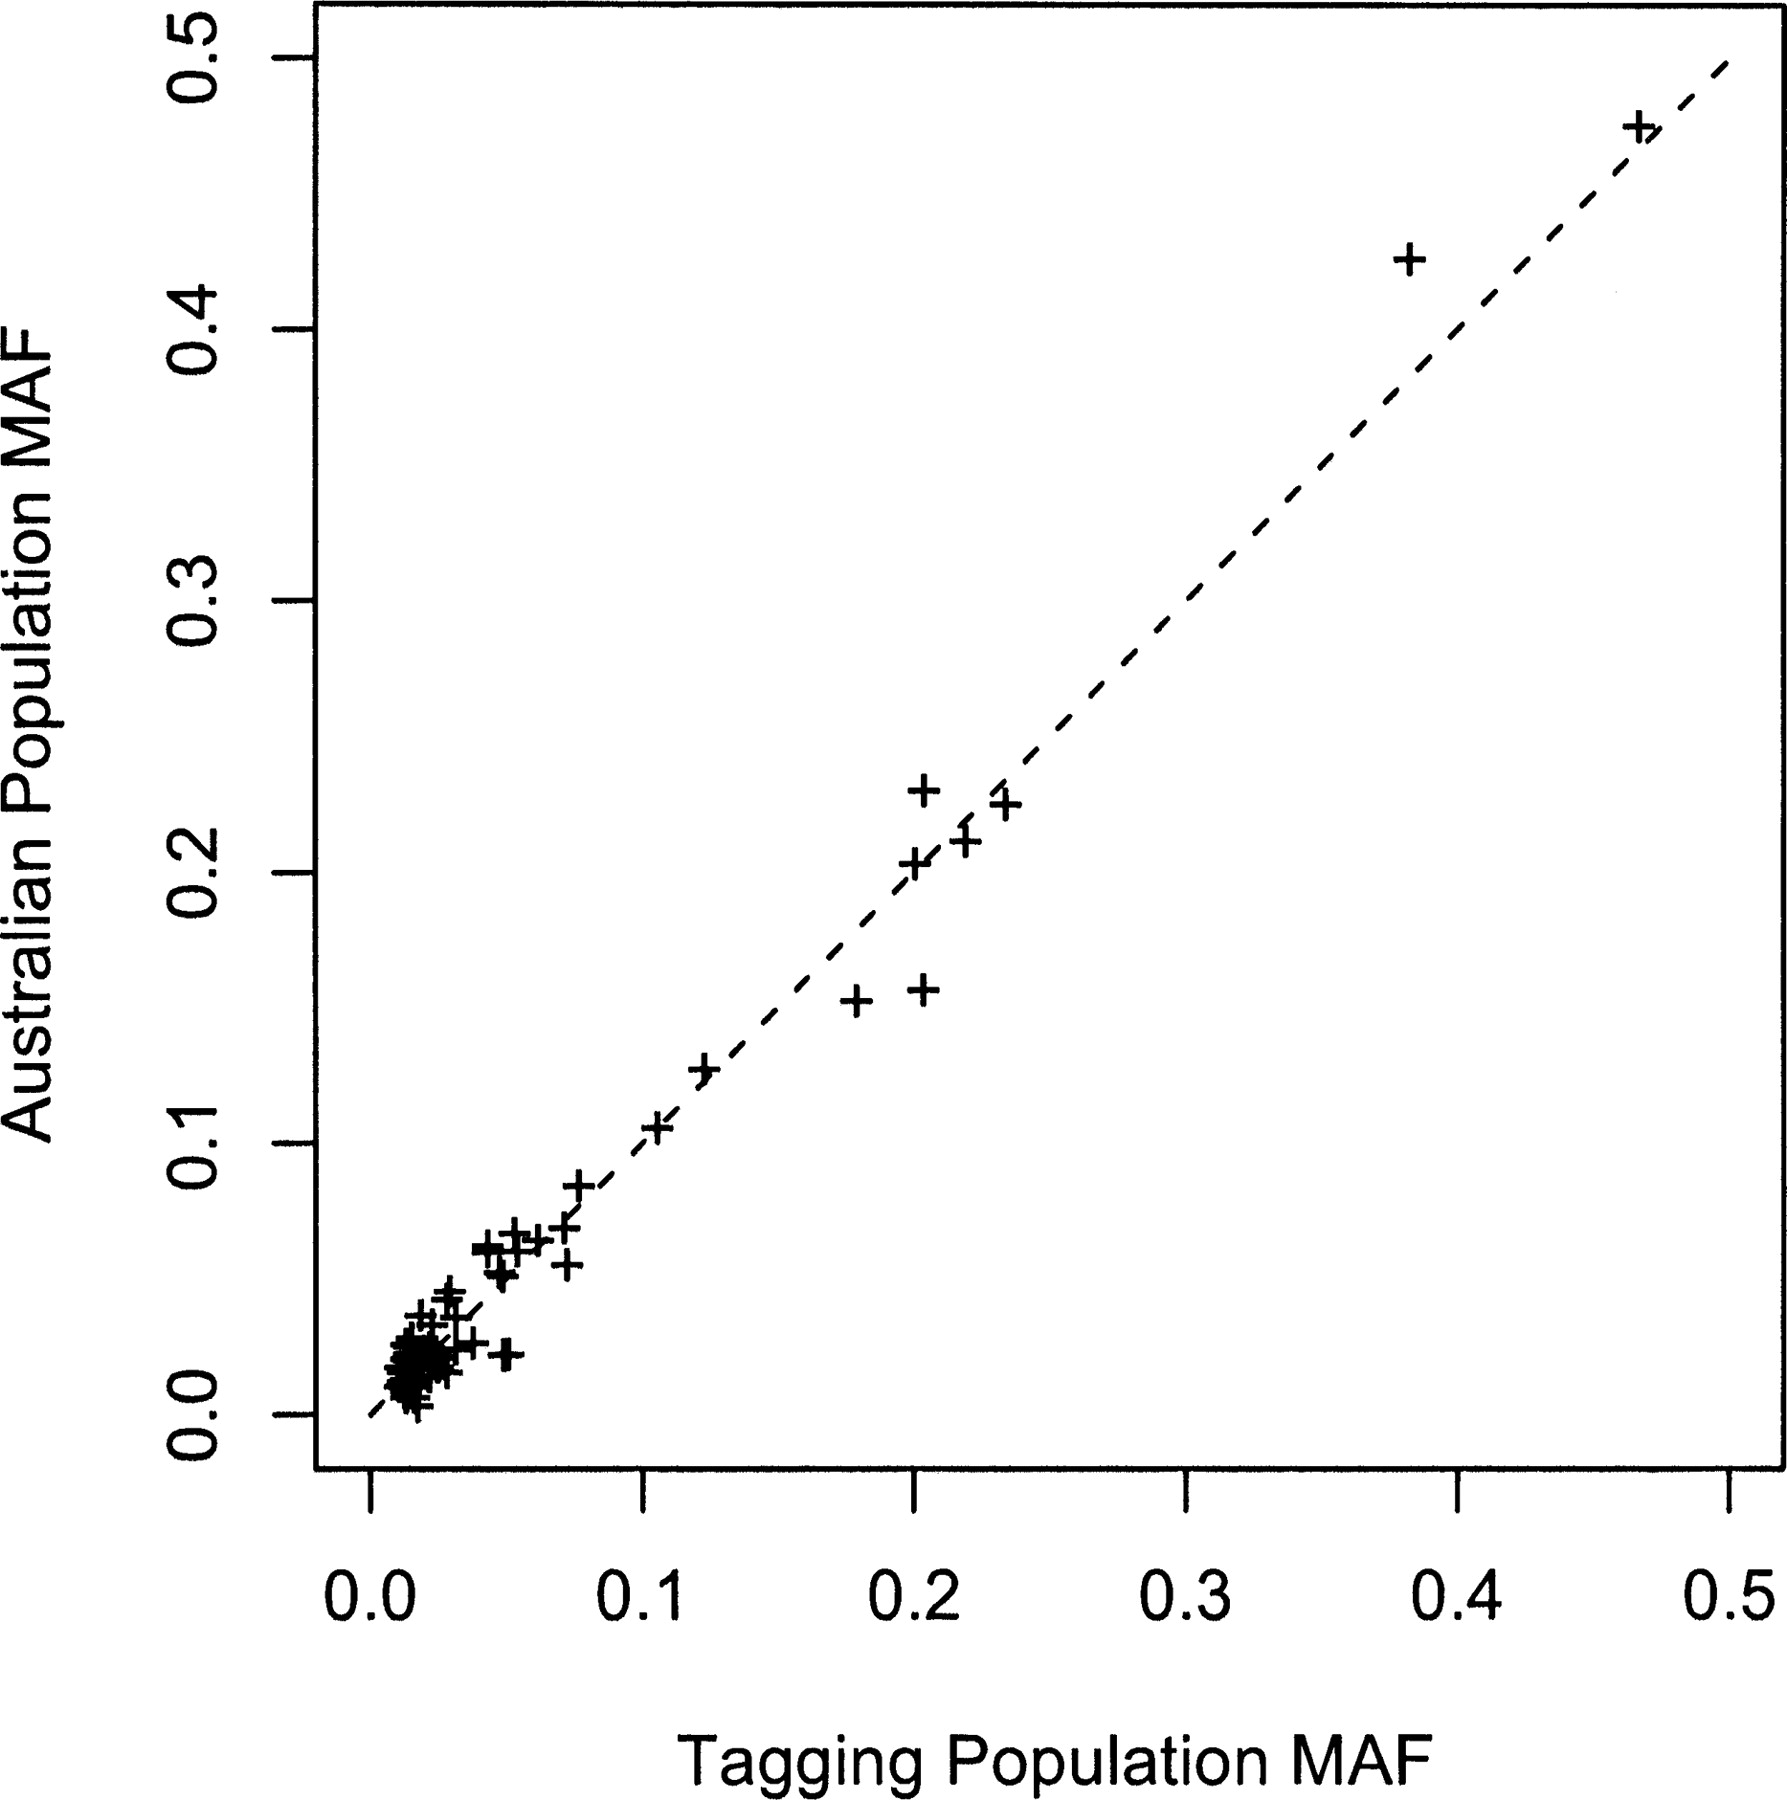
Figure 3.
Allele frequency comparisons between tagging sample and Australian sample. A nearly complete correlation of 0.99 is observed between the two samples.
(Downloading may take up to 30 seconds. If the slide opens in your browser, select File -> Save As to save it.)
Click on image to view larger version.
Allele frequency comparisons between tagging sample and Australian sample. A nearly complete correlation of 0.99 is observed between the two samples.
 CiteULike
 Delicious
 Digg
Digg Facebook
 Google+
 Reddit
 Twitter
