
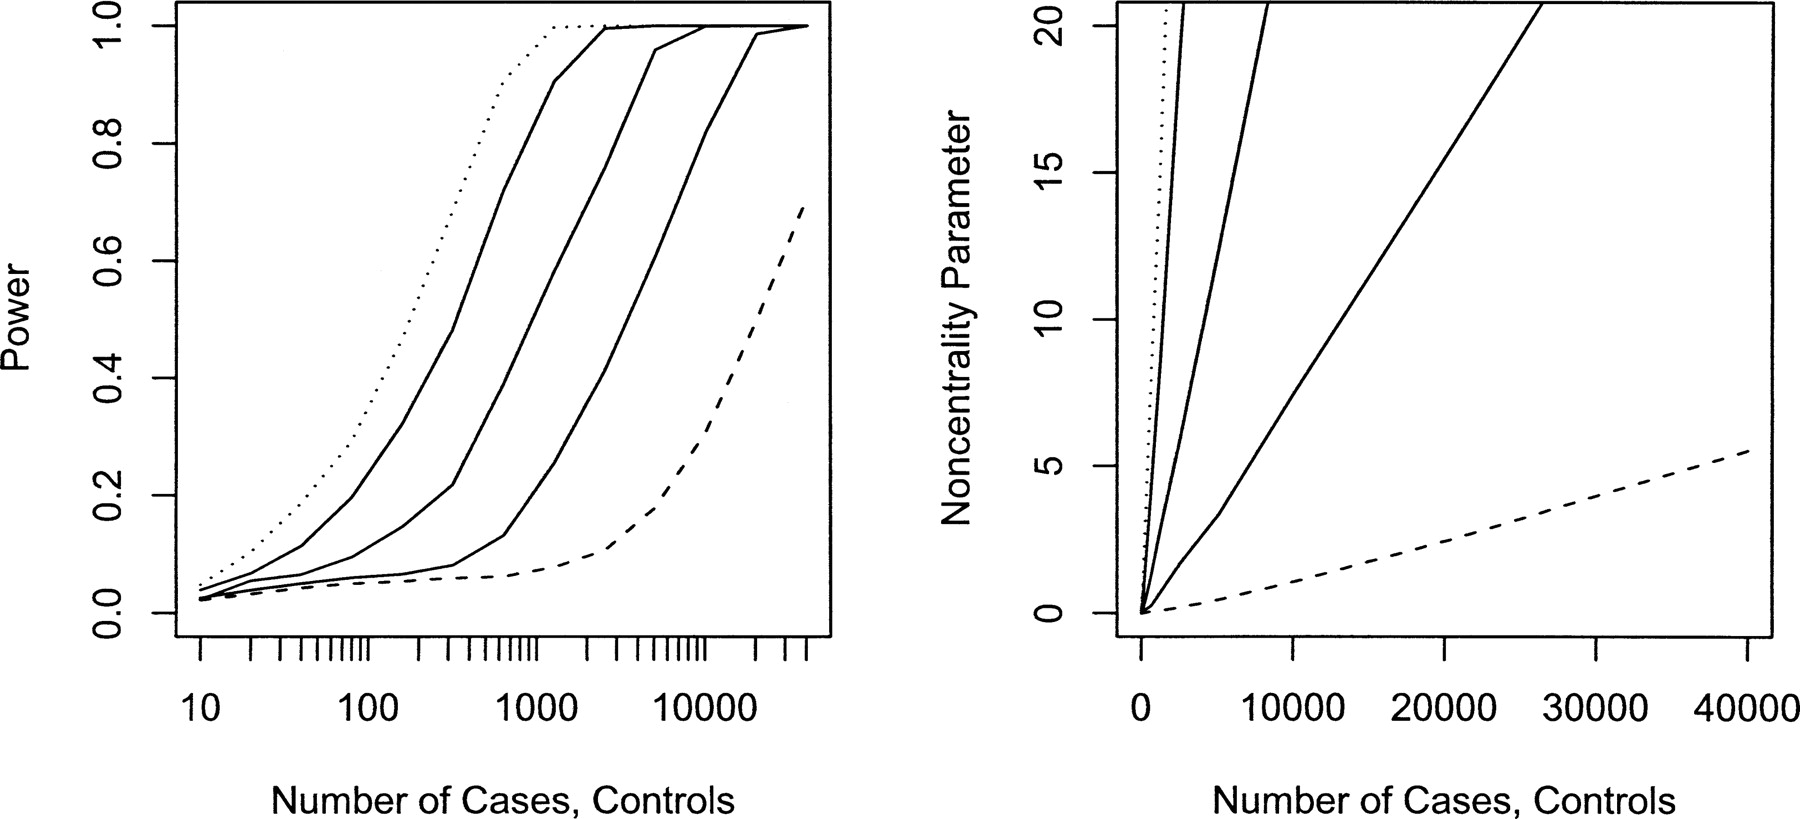
Figure 1.
Power (left) and noncentrality parameter (right) of case-control studies to detect a mitochondrial variant encoding relative risks of 1.2 (dashed line), 1.5, 2, 3, and 4 (dotted line) at a 5% mitochondrial genome-wide significance level. The noncentrality parameter is calculated as the difference in the mean of the distribution of the –log10 of the minimum P-value across all SNPs under the alternative and null hypotheses.


