
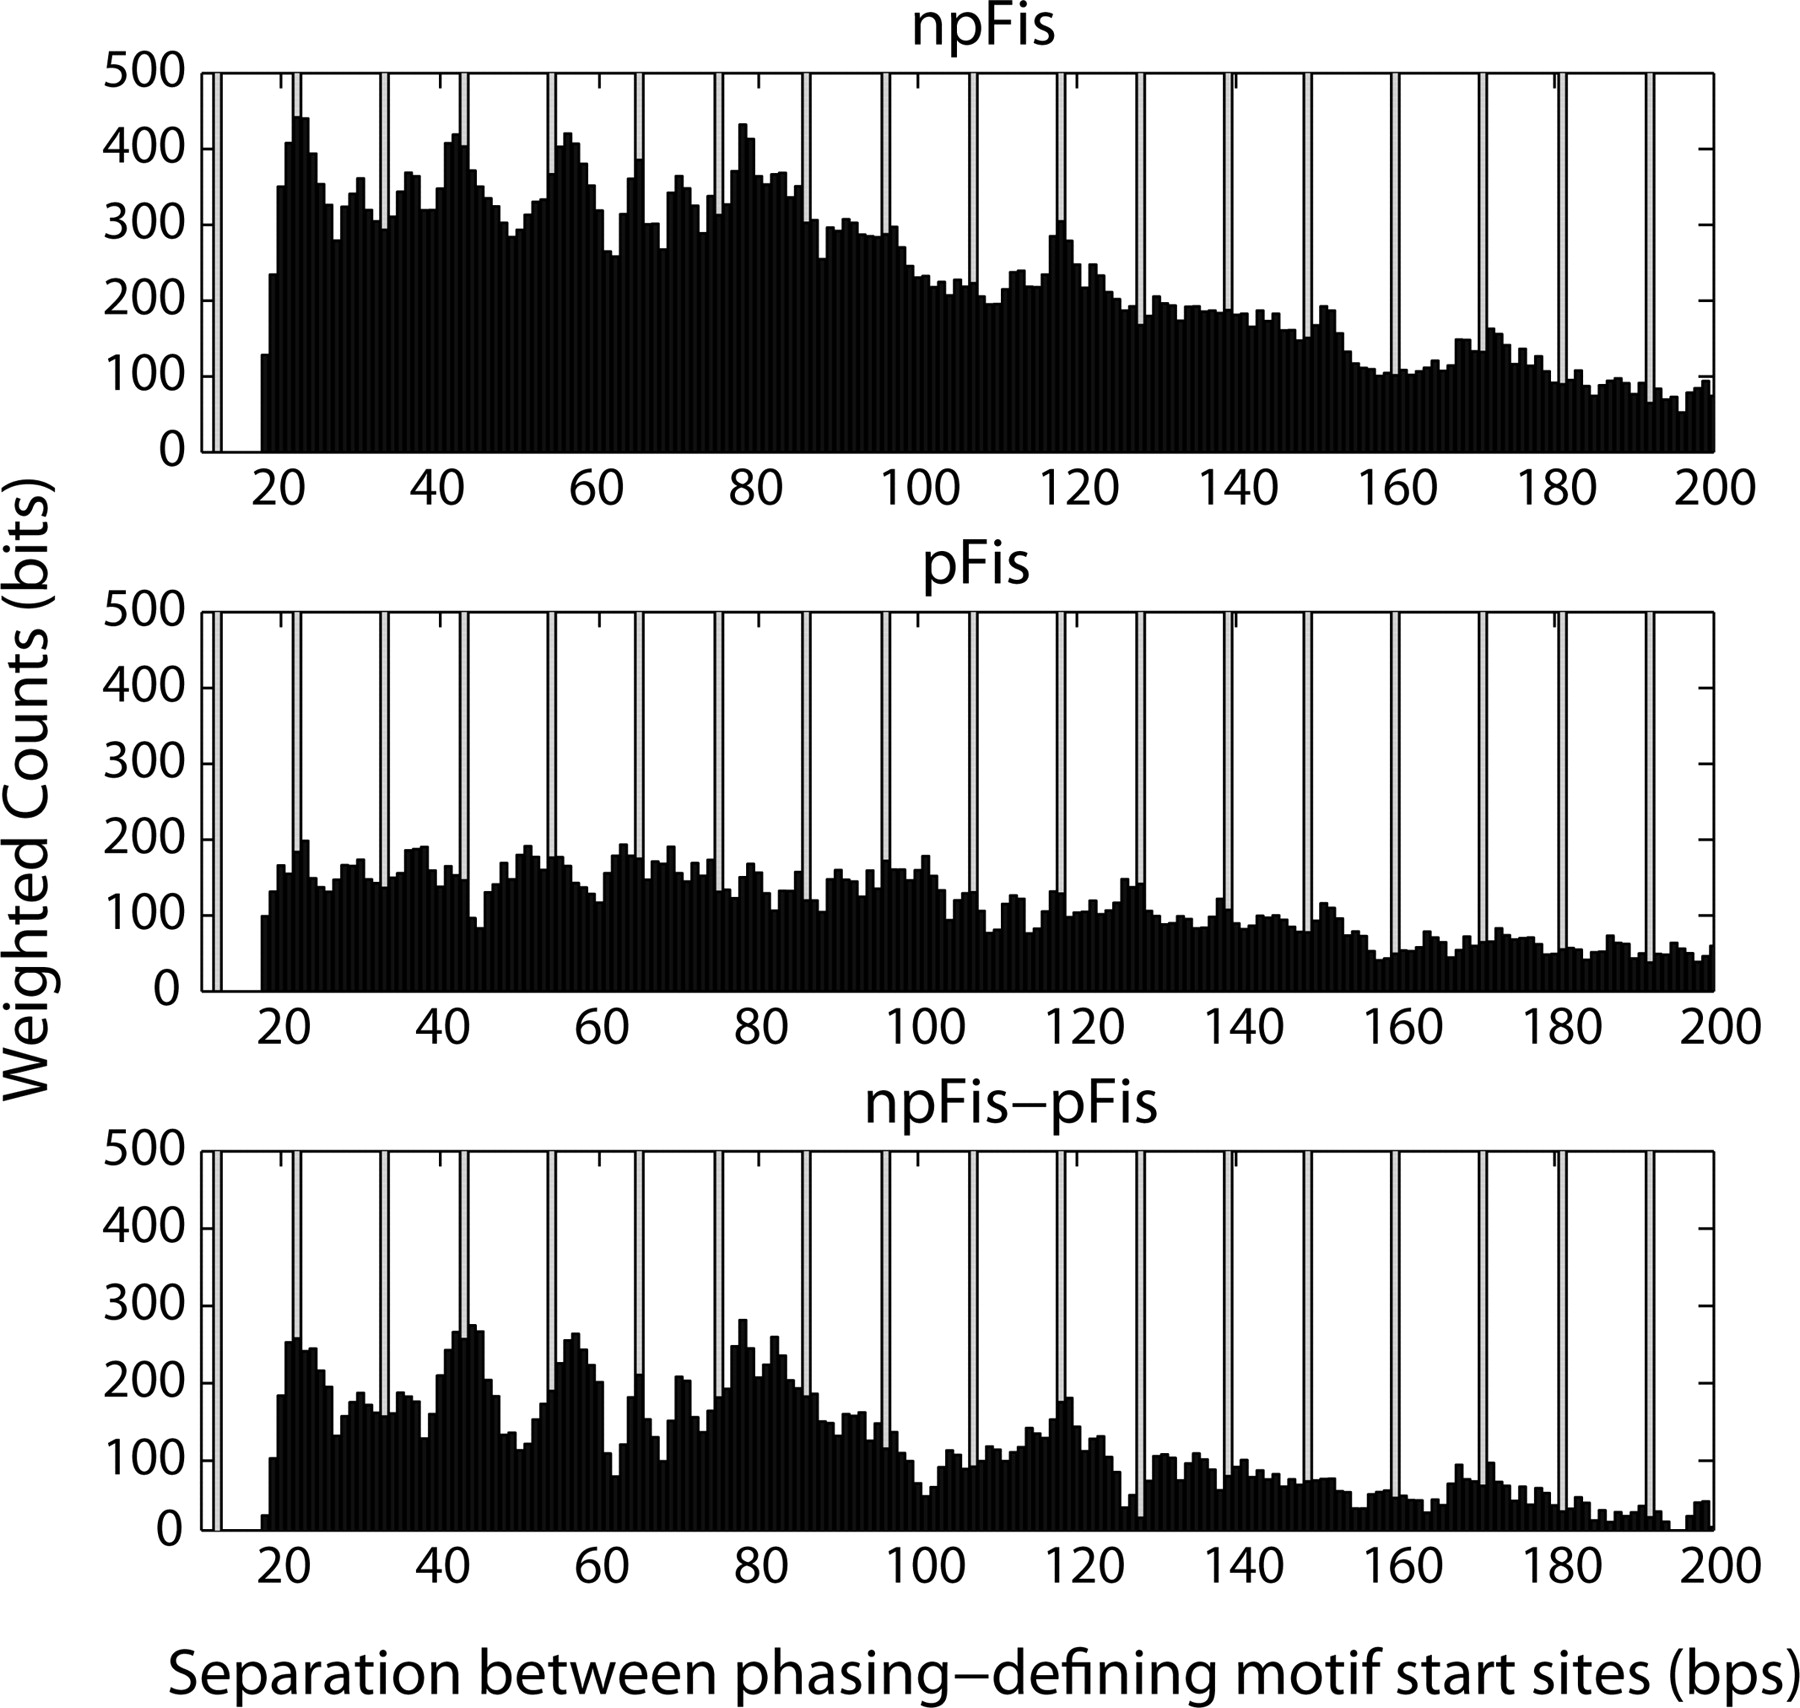
Figure 8.
Histogram of the separation distances between match start sites in the Fis peak regions for the npFis (top) and pFis (middle) motifs. Distances are weighted by the motif match score (Ri value) for each instance when the motif defines a separation distance. The vertical bars indicate the motif separation distances that place the A-tracts in the core of the npFis and pFis motifs (beginning at position 6 in Fig. 6) in perfect helical register (assuming 10.6 bp/helical turn in B-DNA). (Bottom panel) The subtractive difference of the top and middle histograms.


