
Figure 5.
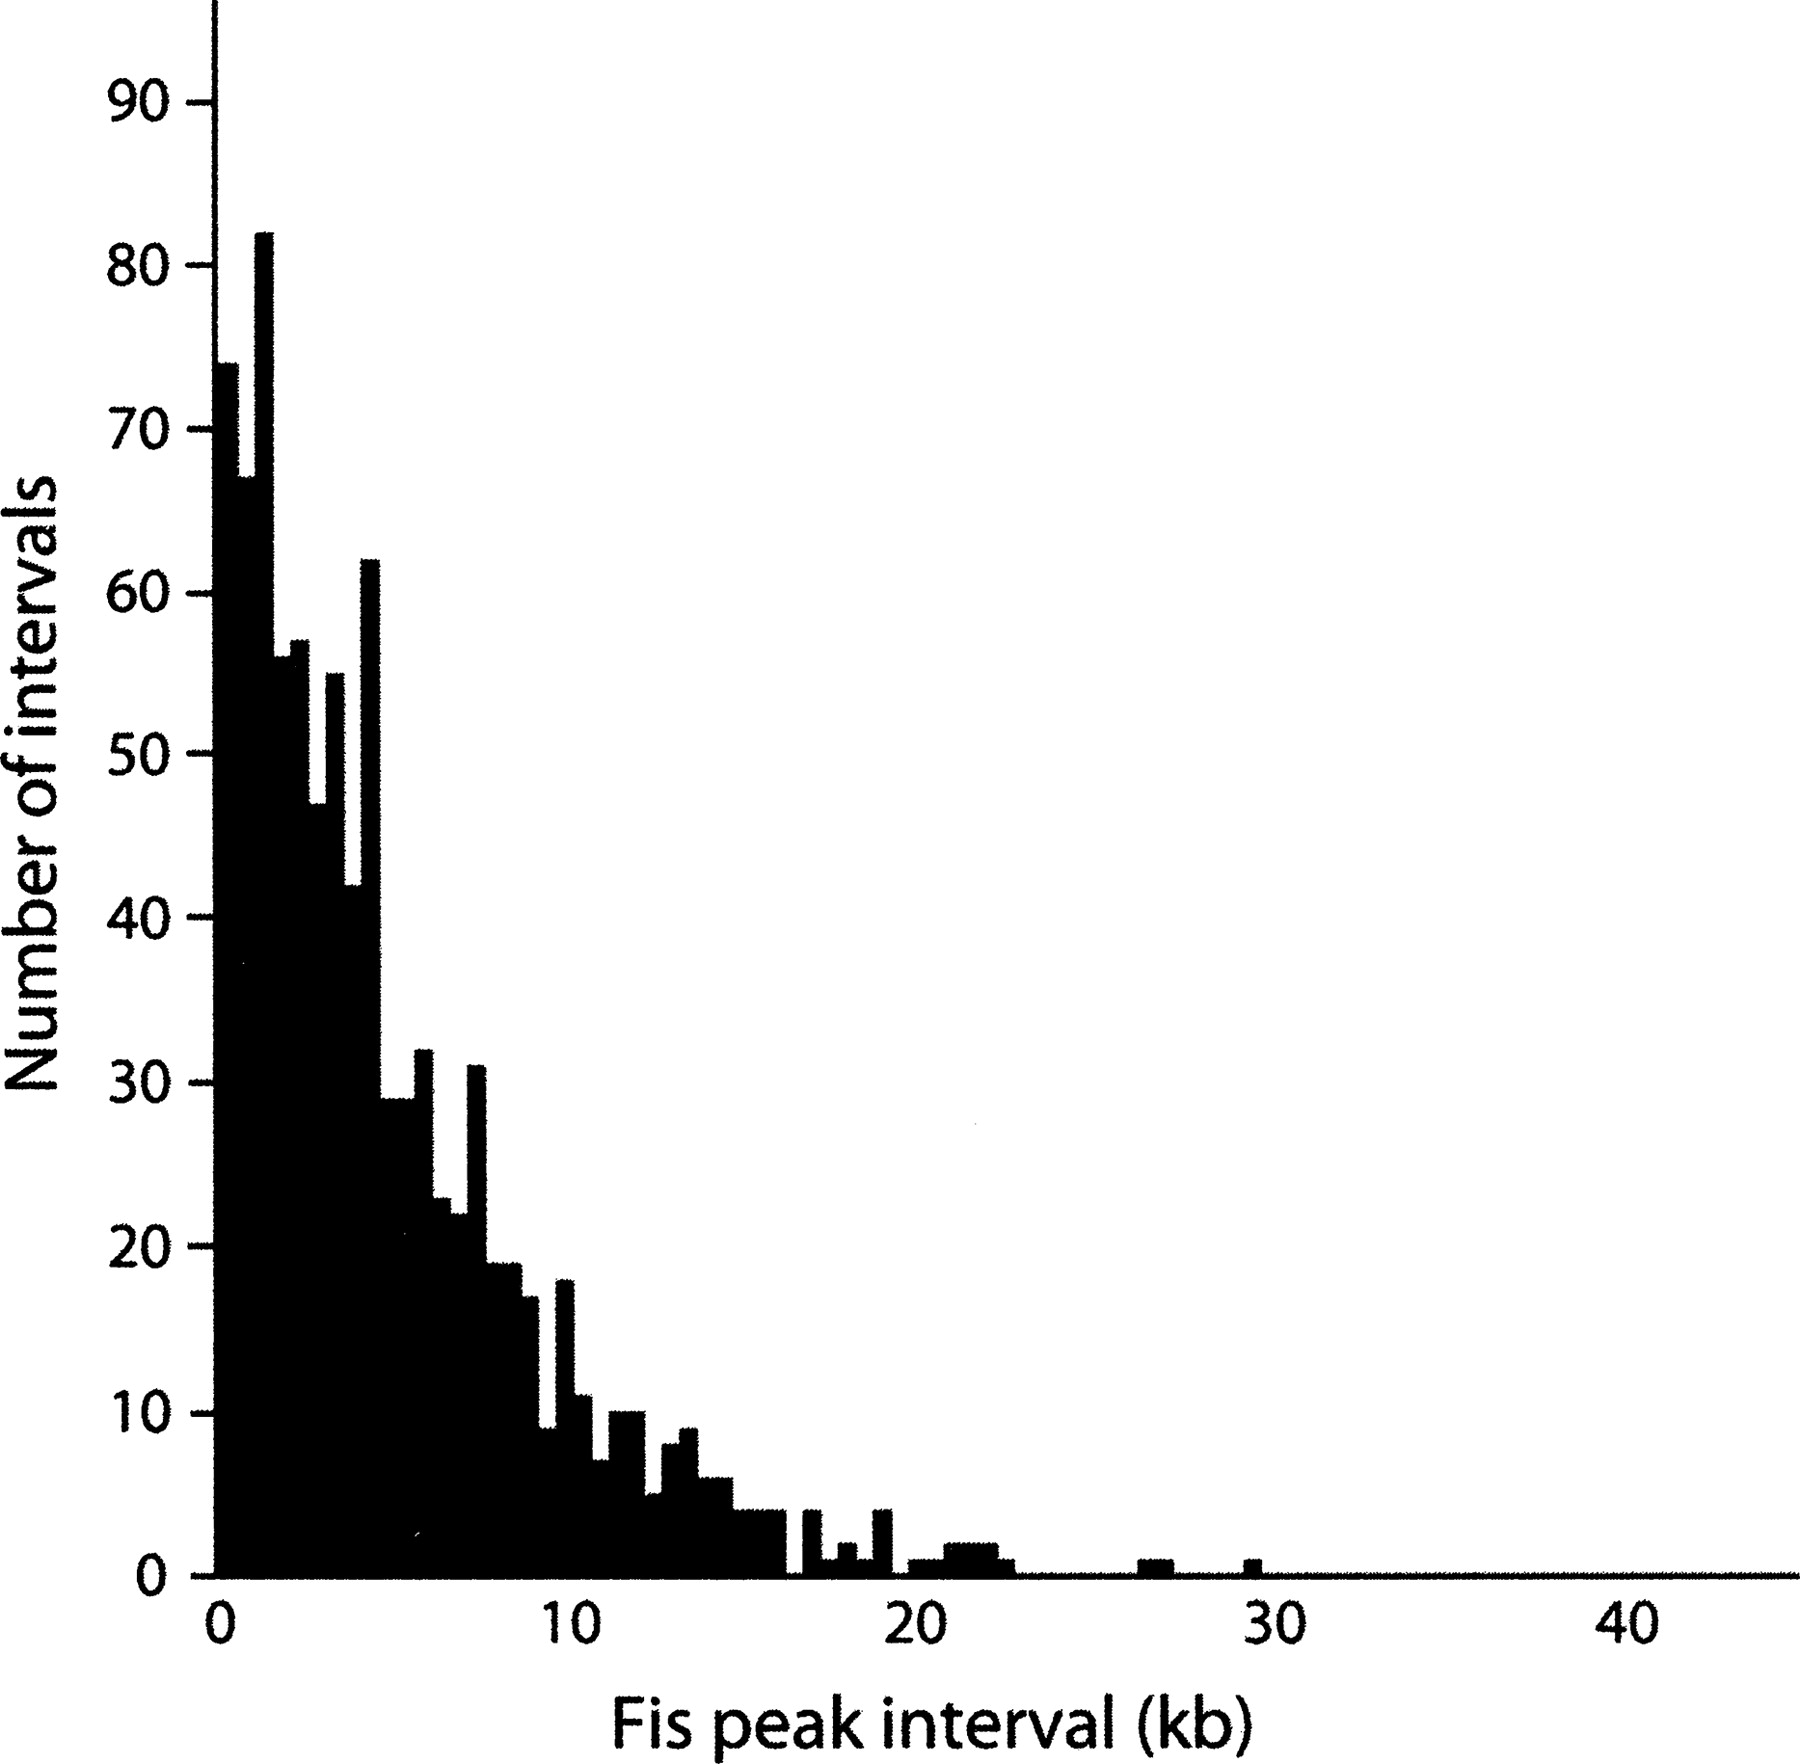
A histogram of the lengths of the intervals between Fis-binding sites identified by ChIP-chip experiments.
(Downloading may take up to 30 seconds. If the slide opens in your browser, select File -> Save As to save it.)
Click on image to view larger version.
A histogram of the lengths of the intervals between Fis-binding sites identified by ChIP-chip experiments.
 CiteULike
 Delicious
 Digg
Digg Facebook
 Google+
 Reddit
 Twitter
