
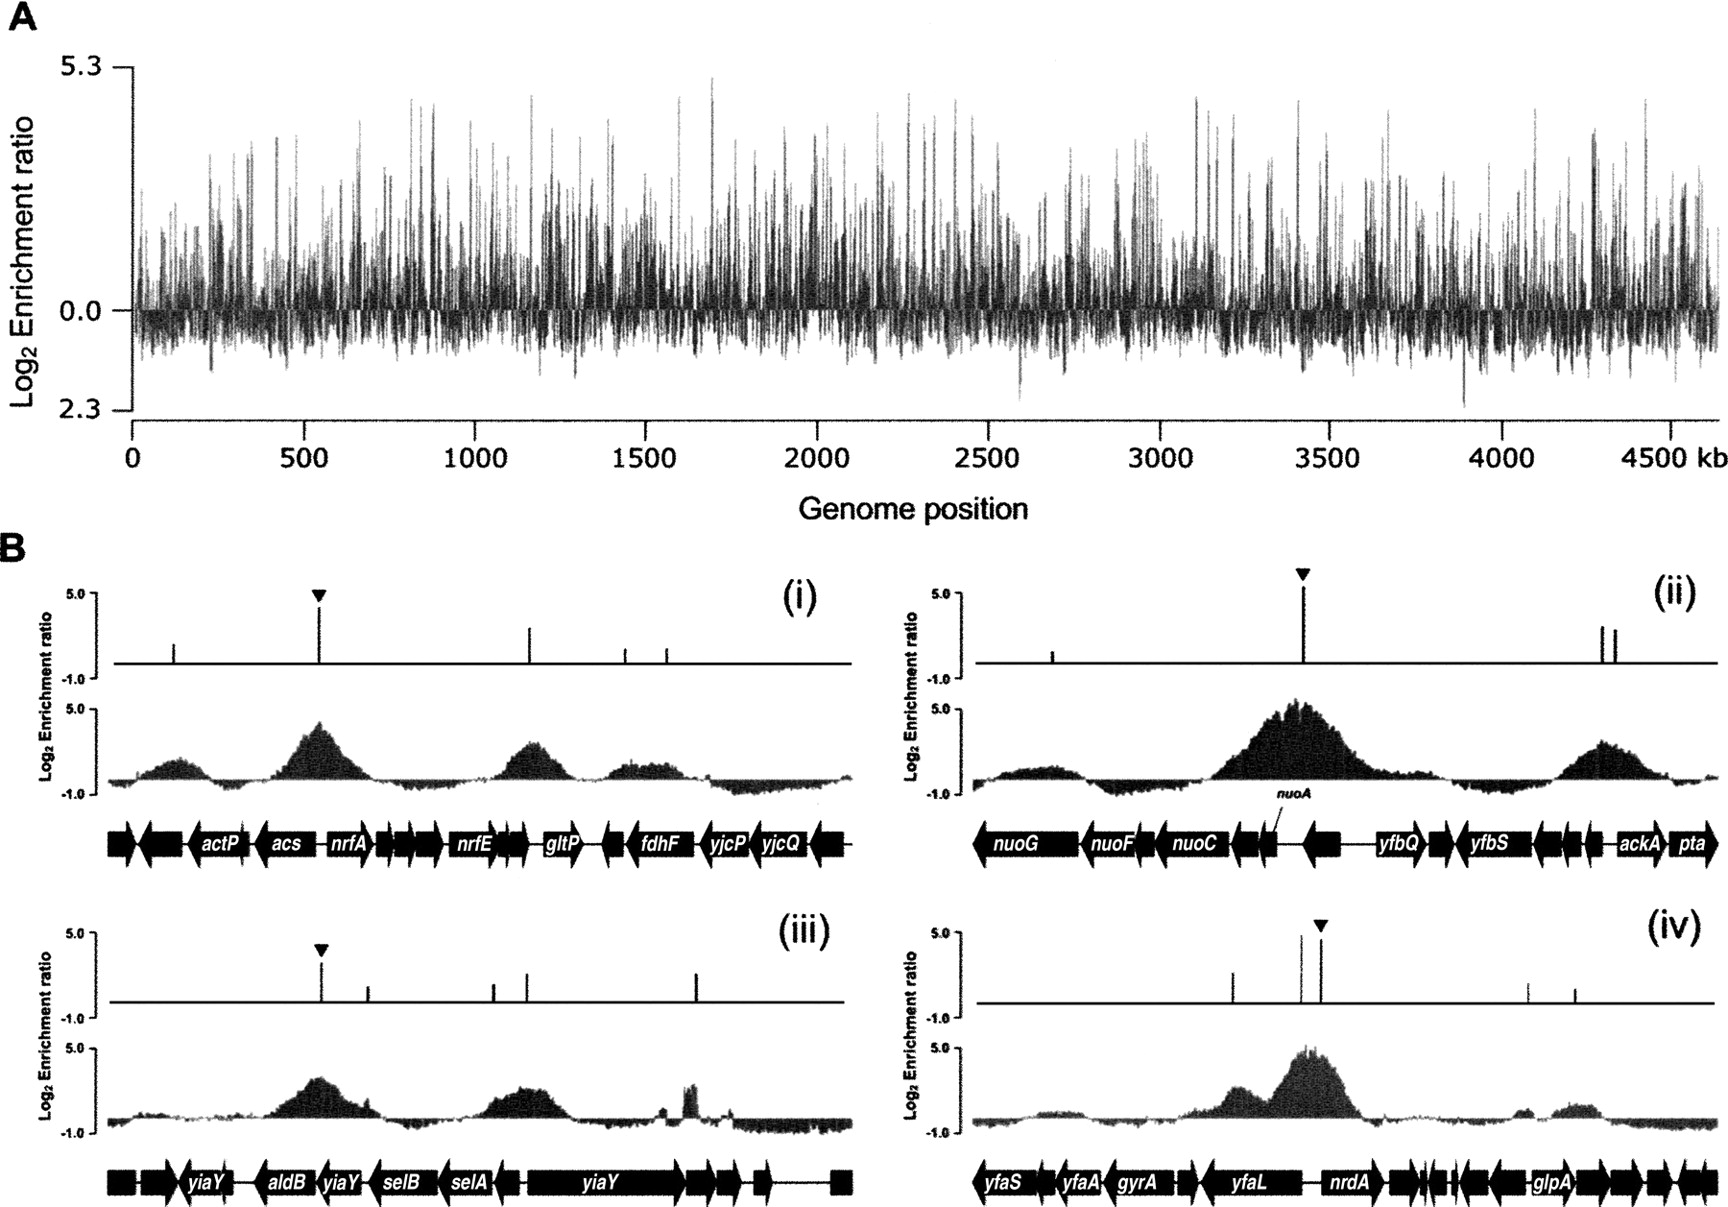
Genome-wide mapping of Fis-binding regions in E. coli. (A) An overview of Fis-binding profiles across the E. coli chromosome at exponential state under aerobic growth conditions. The log2 enrichment ratio on the Y-axis was calculated from Cy5 (IP DNA) and Cy3 (mock IP DNA) signal intensity of each probe and plotted against each location on the 4.64-Mb E. coli chromosome on the X-axis. (B) Determination of genuine Fis-binding peaks on the selected regions. Promoter region of (i) nrfA, (ii) nuoA, (iii) aldB, and (iv) nrdA are occupied by Fis at exponential state under aerobic growth conditions. The peak height of the identified Fis-binding peak is the log2 enrichment ratio calculated from Cy5 (IP DNA) and Cy3 (mock IP DNA) signal intensity of the probe corresponding to the identified peak.


