
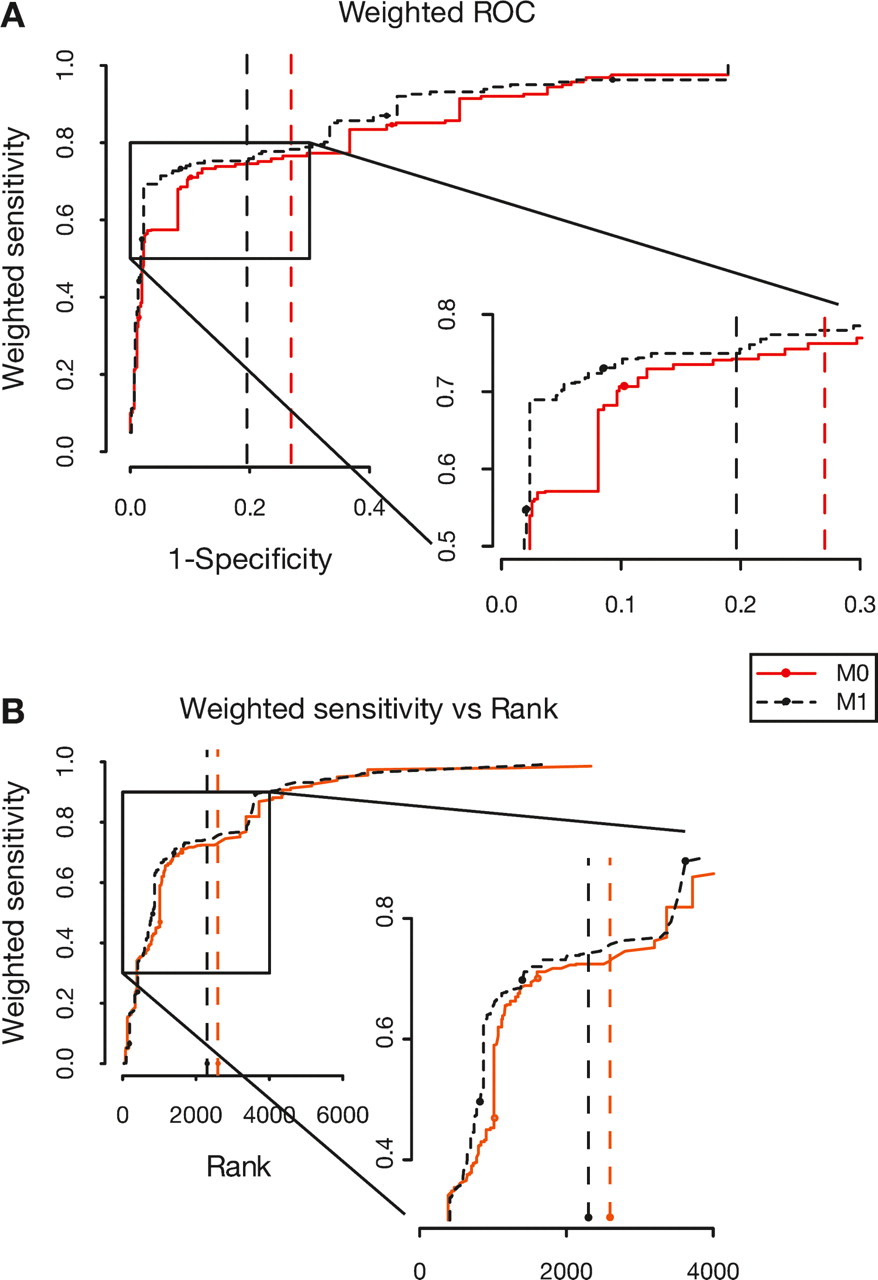
Performance of the M0 and M1 models. (Solid red line and red circles) Performance of M0 model. (Dotted black line and black circles) Performance of M1 model. (Dashed lines) The E = 0.1 threshold for the M0 (red line) and M1 (black line) models, respectively. (A) An artificial background was generated (see Methods). The performance of the M0 and M1 models was measured in terms of sensitivity and specificity. The sensitivity was weighted so that each ncRNA family has an equal contribution to the total sensitivity. The weighted sensitivity is plotted against 1-specificity. (B) Performance on real data. The weighted sensitivity in detecting known or confidently predicted ncRNAs in the D. discoideum genome is plotted against the rank of the corresponding hits.


