
Figure 4.
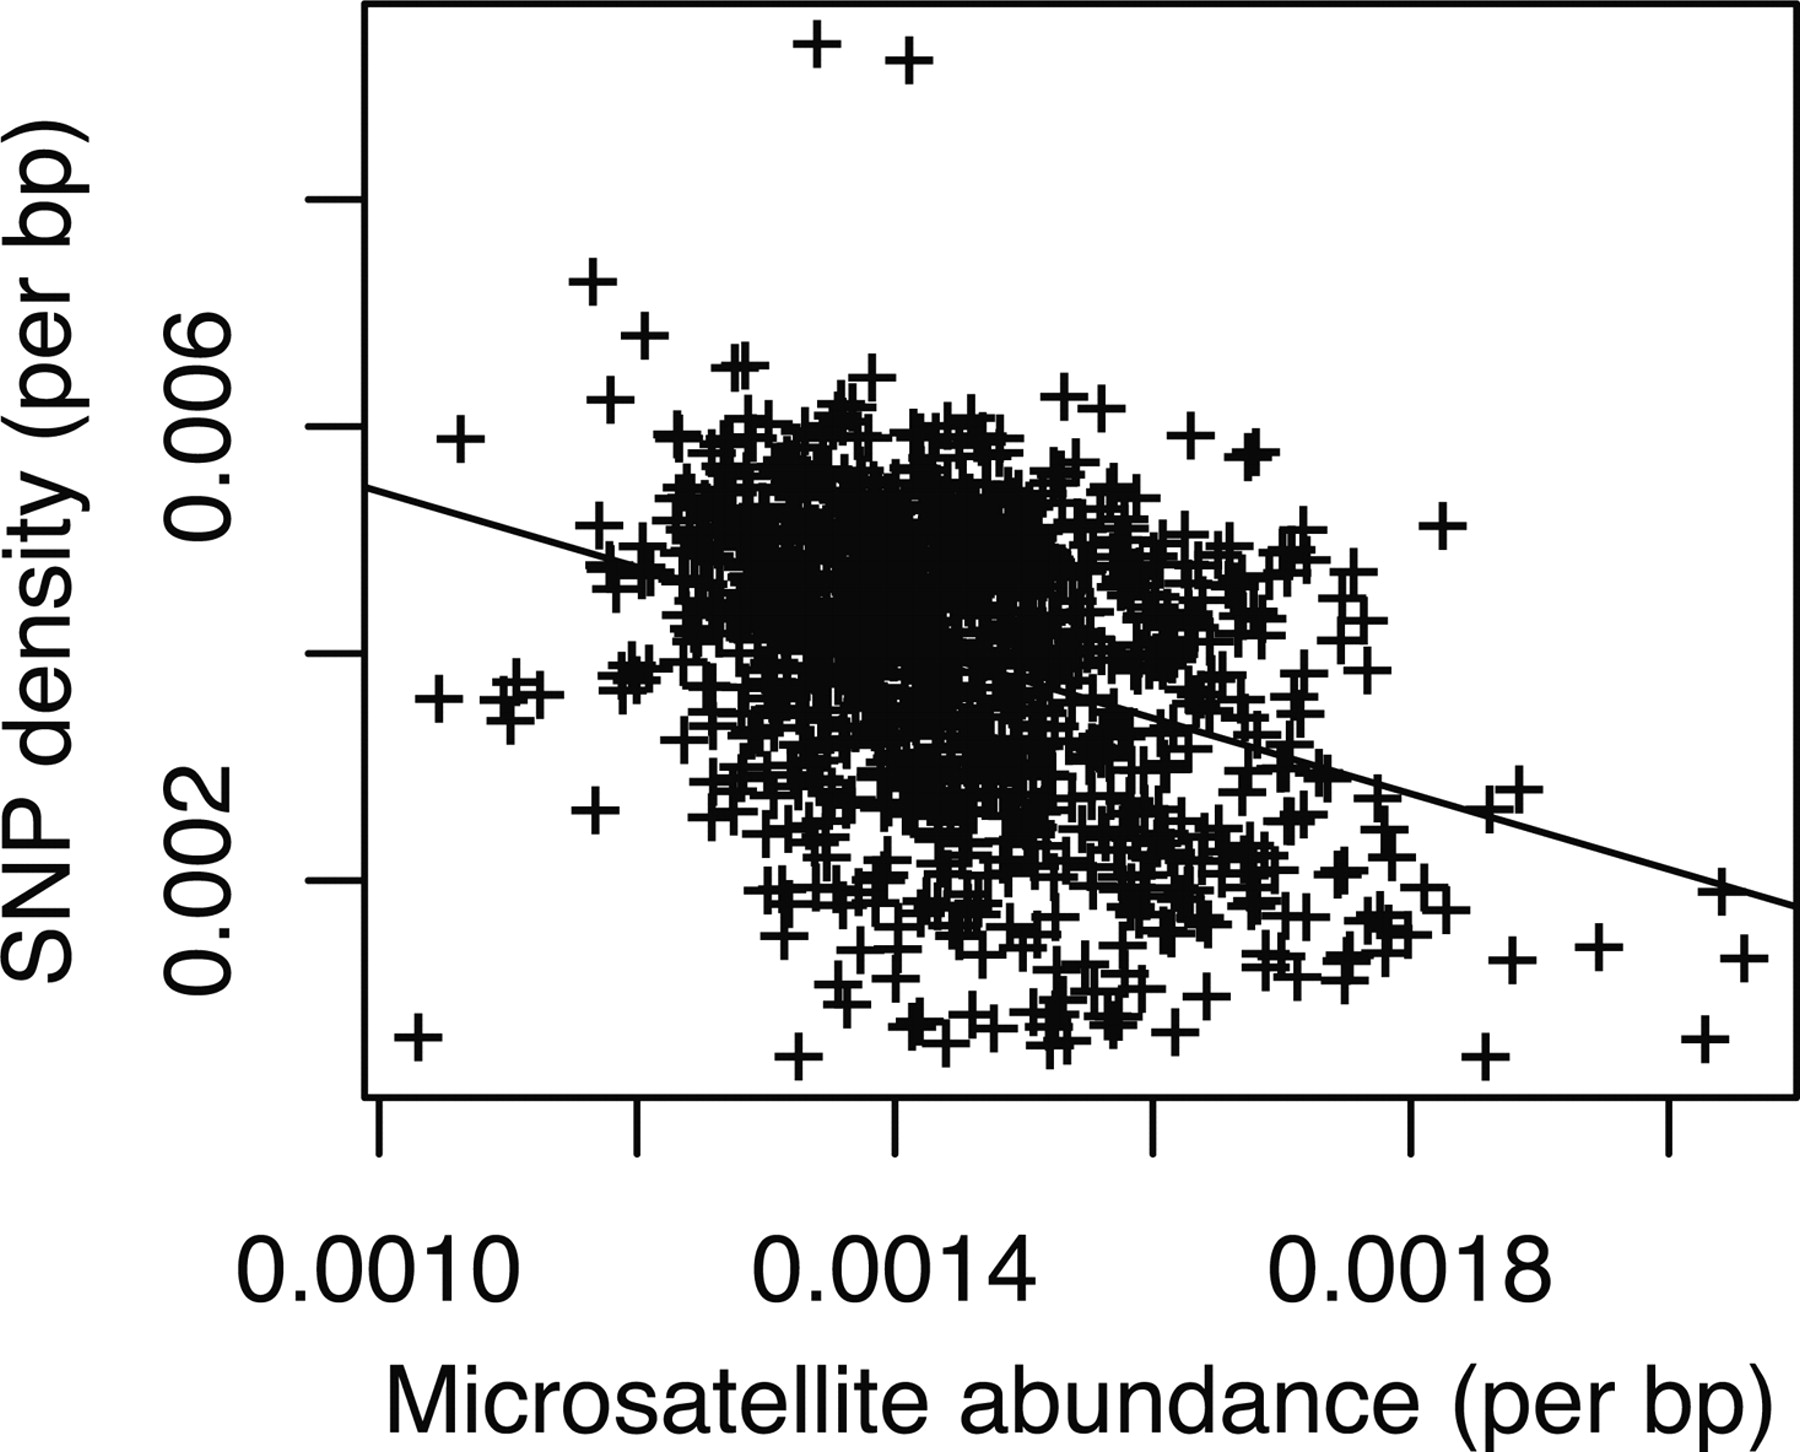
The relationship between SNP density and microsatetellite abundance in nonoverlapping 1 Mb windows (R2 = −0.35, P = 10−15).
(Downloading may take up to 30 seconds. If the slide opens in your browser, select File -> Save As to save it.)
Click on image to view larger version.
The relationship between SNP density and microsatetellite abundance in nonoverlapping 1 Mb windows (R2 = −0.35, P = 10−15).
 CiteULike
 Delicious
 Digg
Digg Facebook
 Google+
 Reddit
 Twitter
