
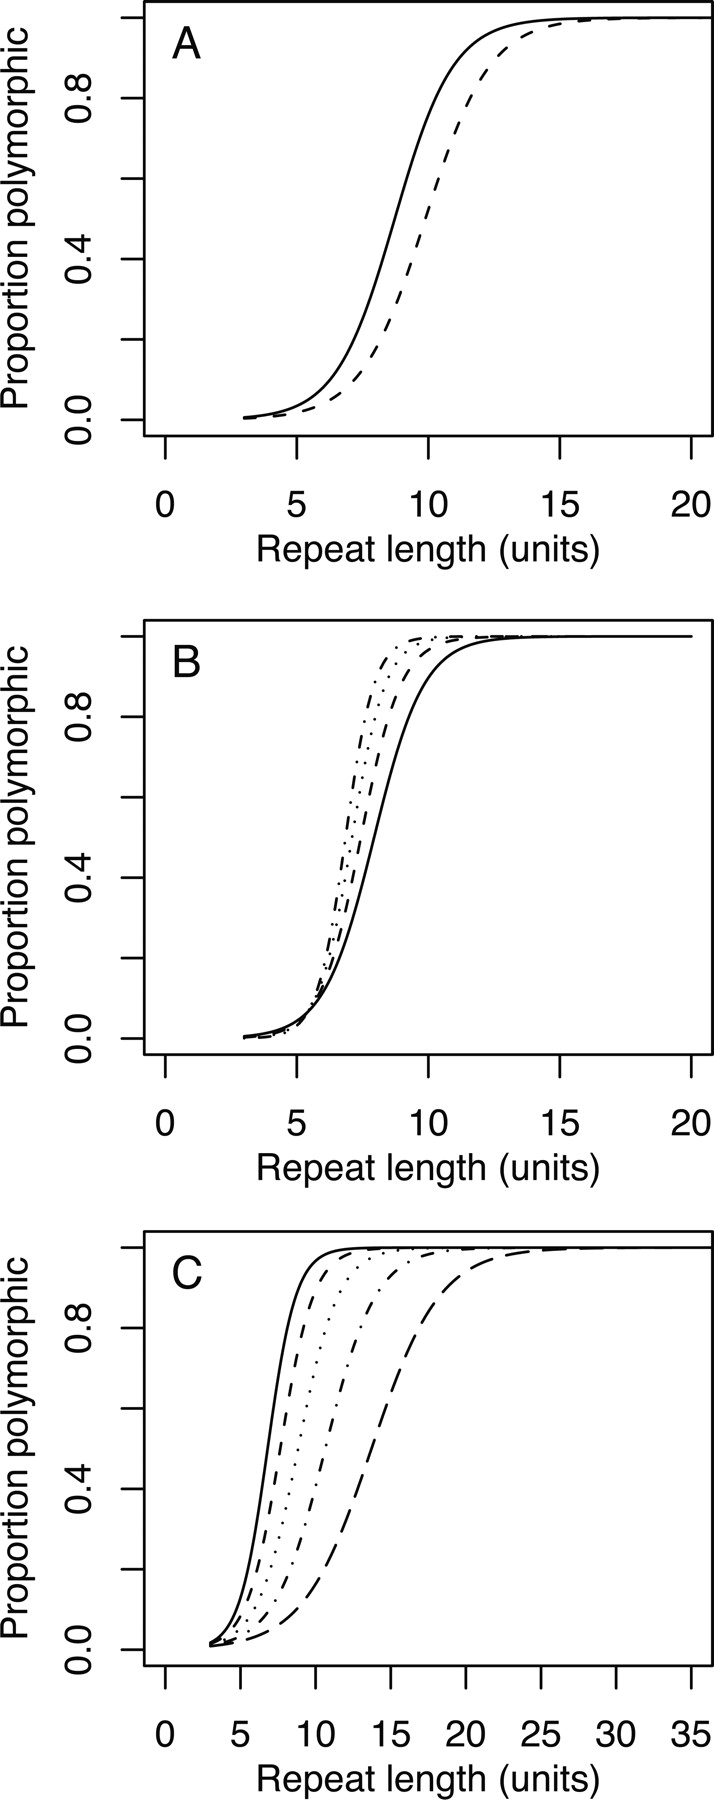
Figure 2.
Fitted logistic regression models of proportion polymorphic microsatellites as a function of microsatellite length for dinucleotide repeats (A), trinucleotide repeats (B), and tetranucleotide repeats (C). (A) (solid line) (AT)n; (dashed line) (AC)n and (AG)n. (B) (Solid line) Motifs with 0% GC; (dashed line) 33% GC; (dotted line) 67% GC; (dotted-dashed line) 100% GC. (C) (Solid line) 0% GC motifs; (short dashed line) 25% GC; (dotted line) 50%; (dotted-dashed line) 75%; (long dashed line) 100% GC.


