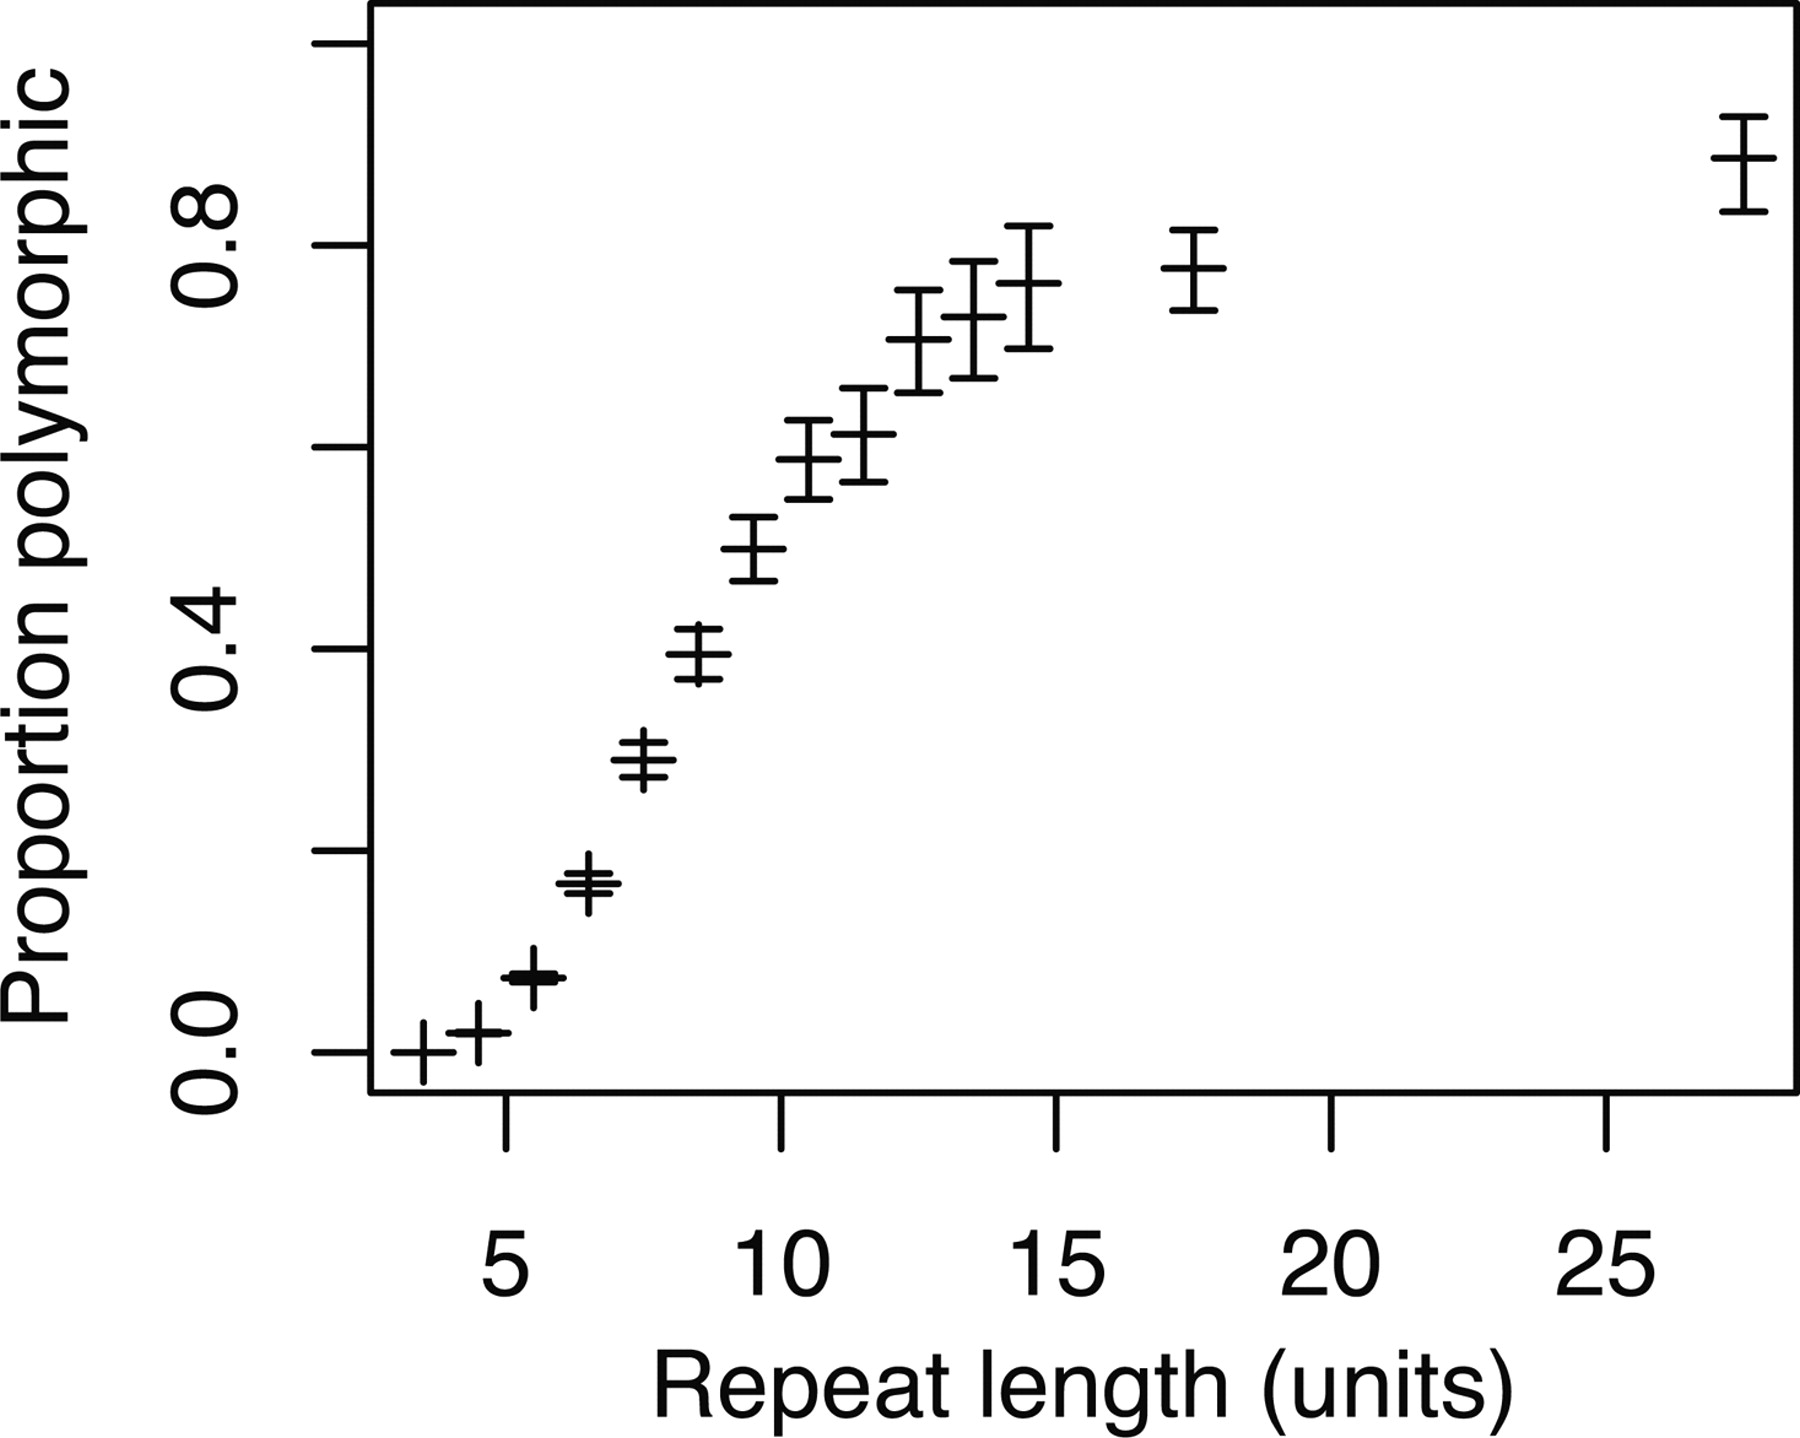
Genome-wide analysis of microsatellite polymorphism in chicken circumventing the ascertainment bias

(Downloading may take up to 30 seconds. If the slide opens in your browser, select File -> Save As to save it.)

Click on image to view larger version.

Figure 1.
Figure 1.

Proportion of dimorphic loci in relation to repeat length for all microsatellites. Whiskers indicate the 95% confidence interval. Because of small sample size, results from the 15–20 and 20–35 repeat unit intervals have been pooled.

This Article

  1. Genome Res. 18: 881-887

Preprint Server