
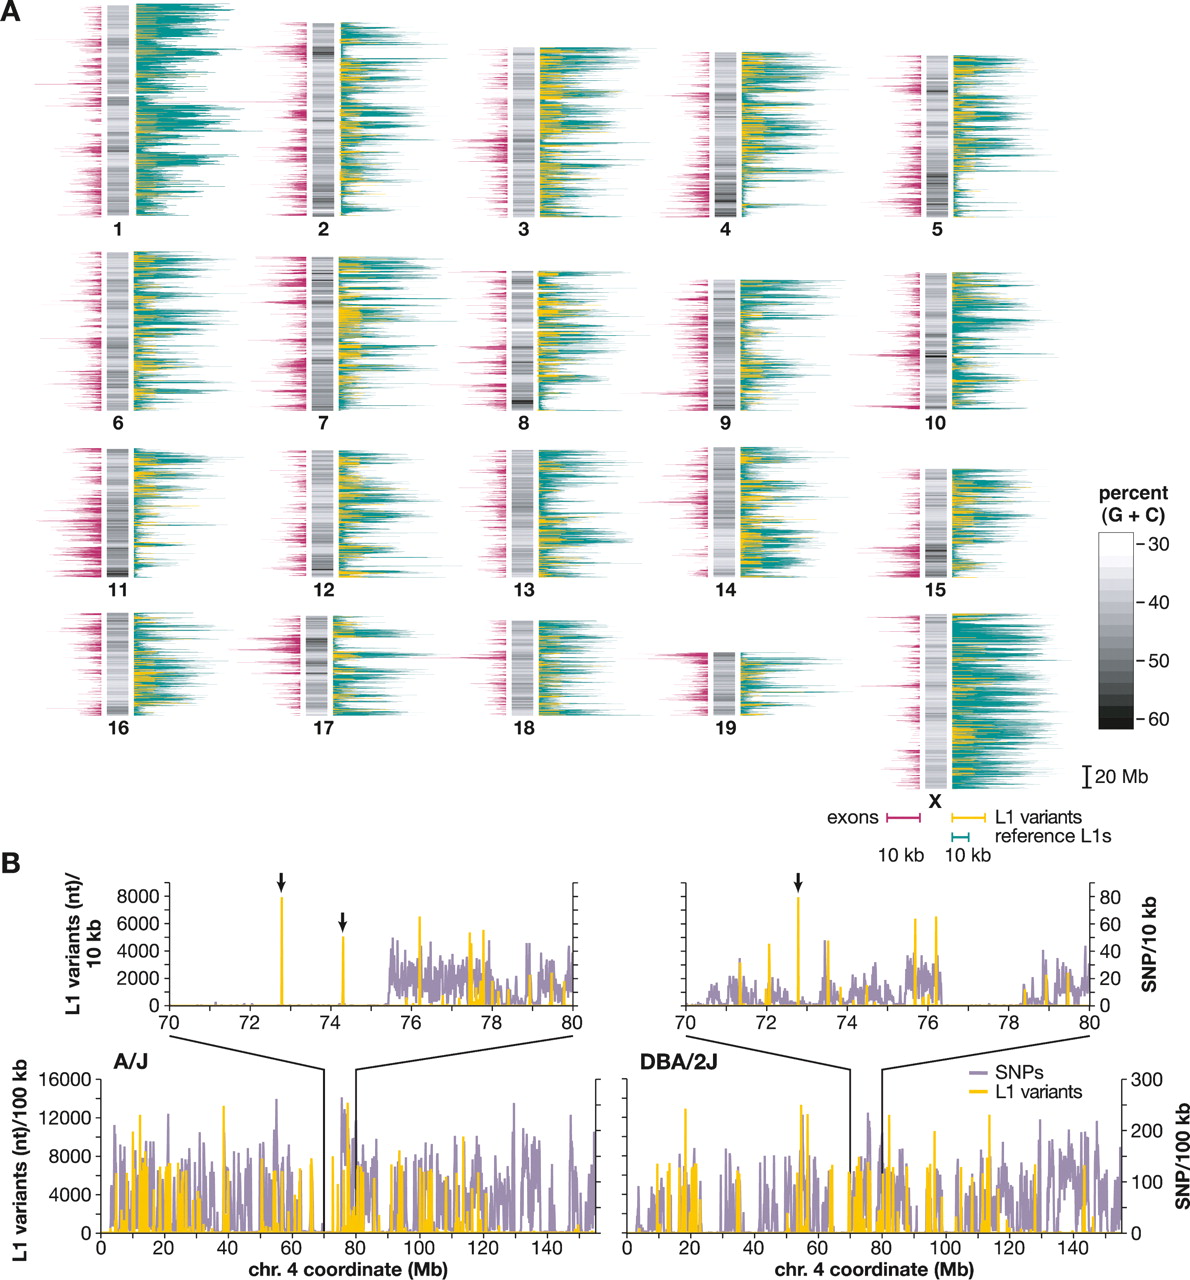
Chromosomal distribution of mouse L1s and SNPs. (A) A schematic mouse karyotype containing 19 autosomes and the X chromosome (vertical bars, middle), indicates variable G:C content (grayscale). Darker shades indicate (G+C)-rich regions. Histograms display exon content (left, maroon), reference C57 strain L1 retrotransposons (right, green), and polymorphic L1s absent from an unassembled strain(s) (right, yellow), as nucleotide per 100 kb genomic sequence (scale bars, 10 kb per 100 kb genomic sequence, below X chromosome). (B) Densities of SNPs (lavender) and L1 variants (yellow) are compared between two strains each along chromosome 4 and (inset) at its coordinates 70–80 Mb. (Left) A/J vs. C57 reference; (right) DBA/2J vs. C57, nucleotide per 10 kb. Note that the nucleotide scale differs between L1 (Y-axis, left) and SNPs (right) by a factor of 100×. Polymorphic L1 integrants in chromosomal regions lacking SNPs in these pairwise comparisons are marked (arrows).


