
Table 1A.
Mean number of false placements of K-mers on the genome
Click on table to view larger version.
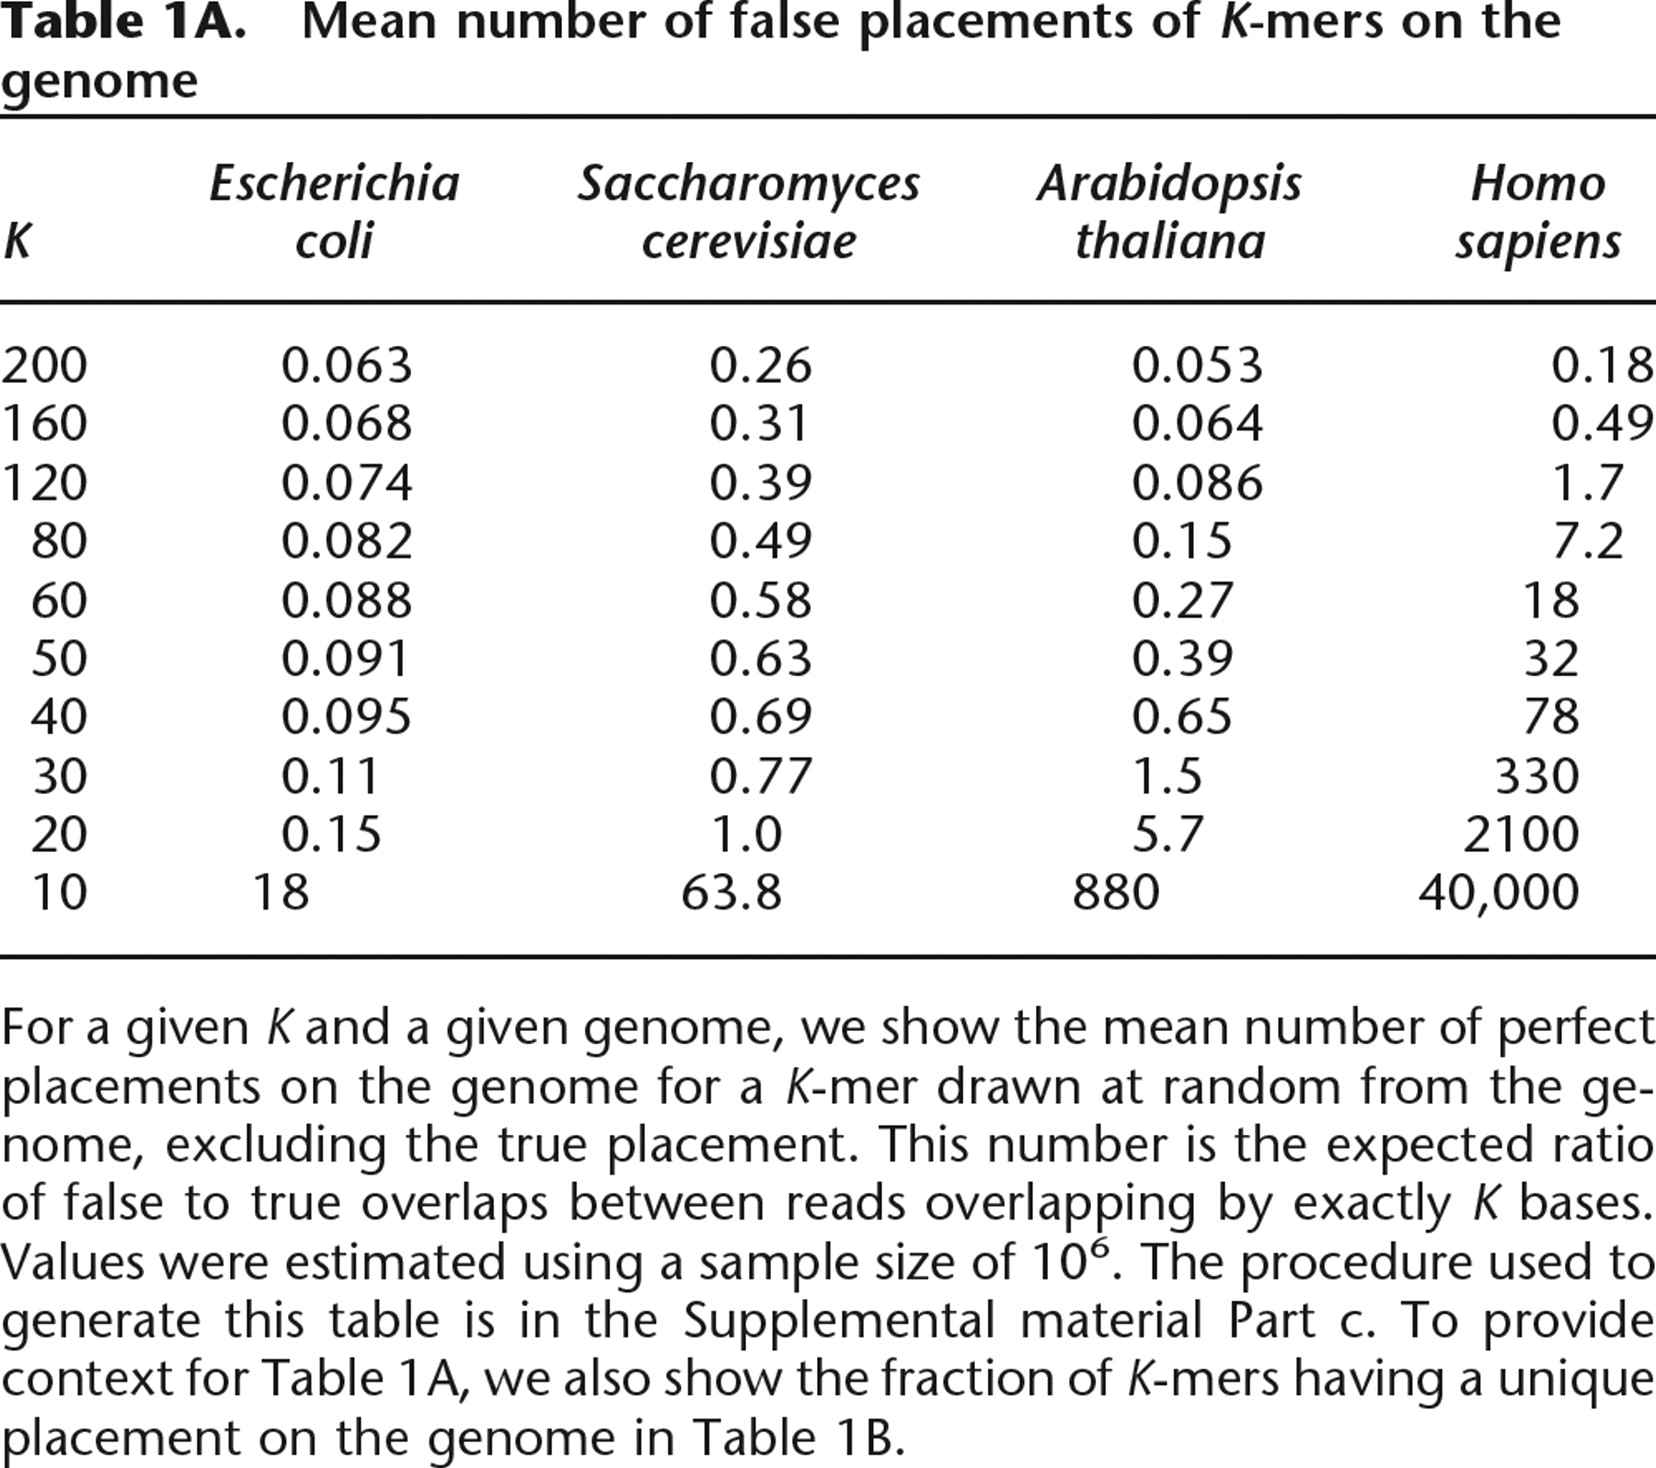
For a given K and a given genome, we show the mean number of perfect placements on the genome for a K-mer drawn at random from the genome, excluding the true placement. This number is the expected ratio of false to true overlaps between reads overlapping by exactly K bases. Values were estimated using a sample size of 106. The procedure used to generate this table is in the Supplemental material Part c. To provide context for Table 1A, we also show the fraction of K-mers having a unique placement on the genome in Table 1B.


