
Table 4.
Correlation between microarray platforms and Illumina GoldenGate reference data (these are computed from the points shown in Fig. 2)
Click on table to view larger version.
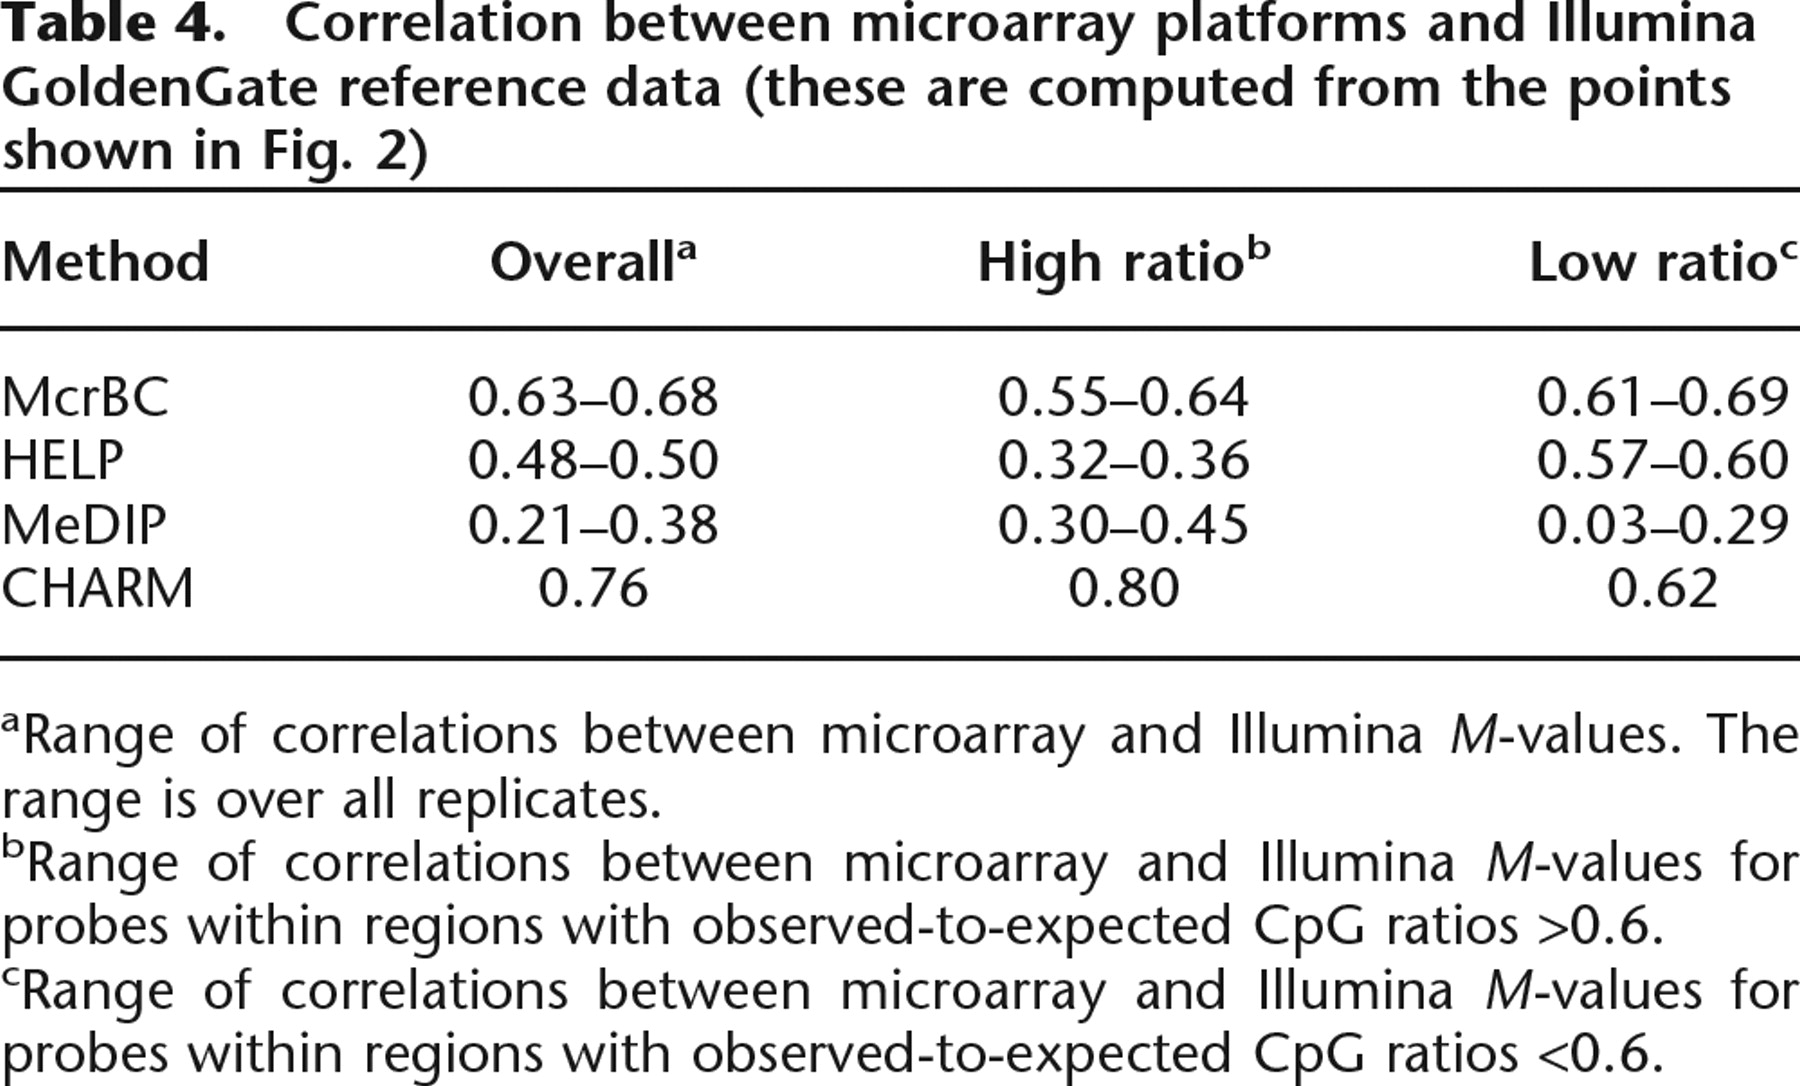
aRange of correlations between microarray and Illumina M-values. The range is over all replicates.
bRange of correlations between microarray and Illumina M-values for probes within regions with observed-to-expected CpG ratios >0.6.
cRange of correlations between microarray and Illumina M-values for probes within regions with observed-to-expected CpG ratios <0.6.


