
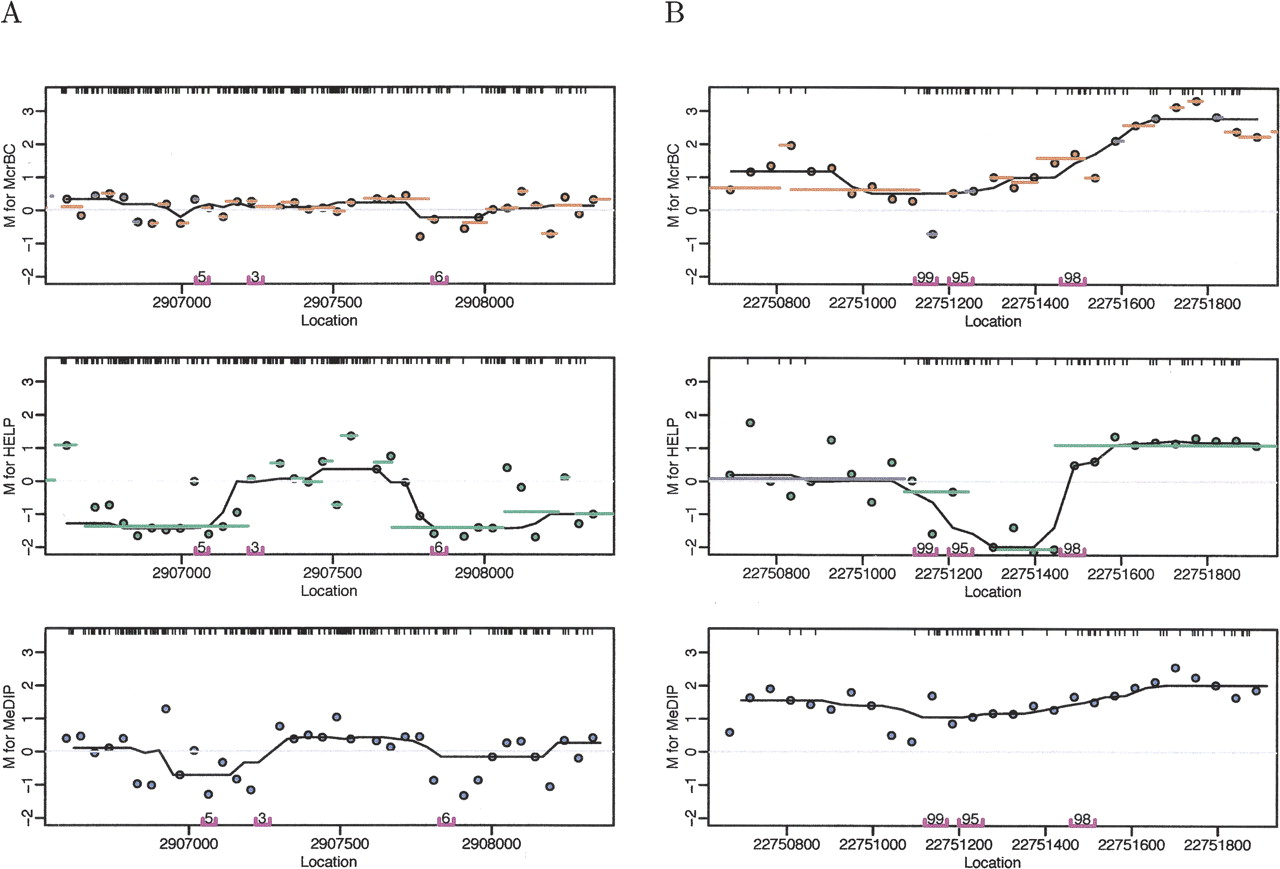
M values plotted against contiguous locations on the genome for all three methods. The points are the observed M-values. The M-values for probes in the same predicted segments for McrBC and HELP were averaged and are represented in the figure with orange and green lines, respectively. The data were smoothed using running medians with a window size of 7 and showed the results with black curves. CpG locations are shown as black tick marks at the top of the plots. (A) Segment showing lack of methylation determined by the Illumina platform. (B) Segment with high methylation as determined by the Illumina platform. The Illumina probes and measured methylation percentages are shown on the bottom of the plot.


