
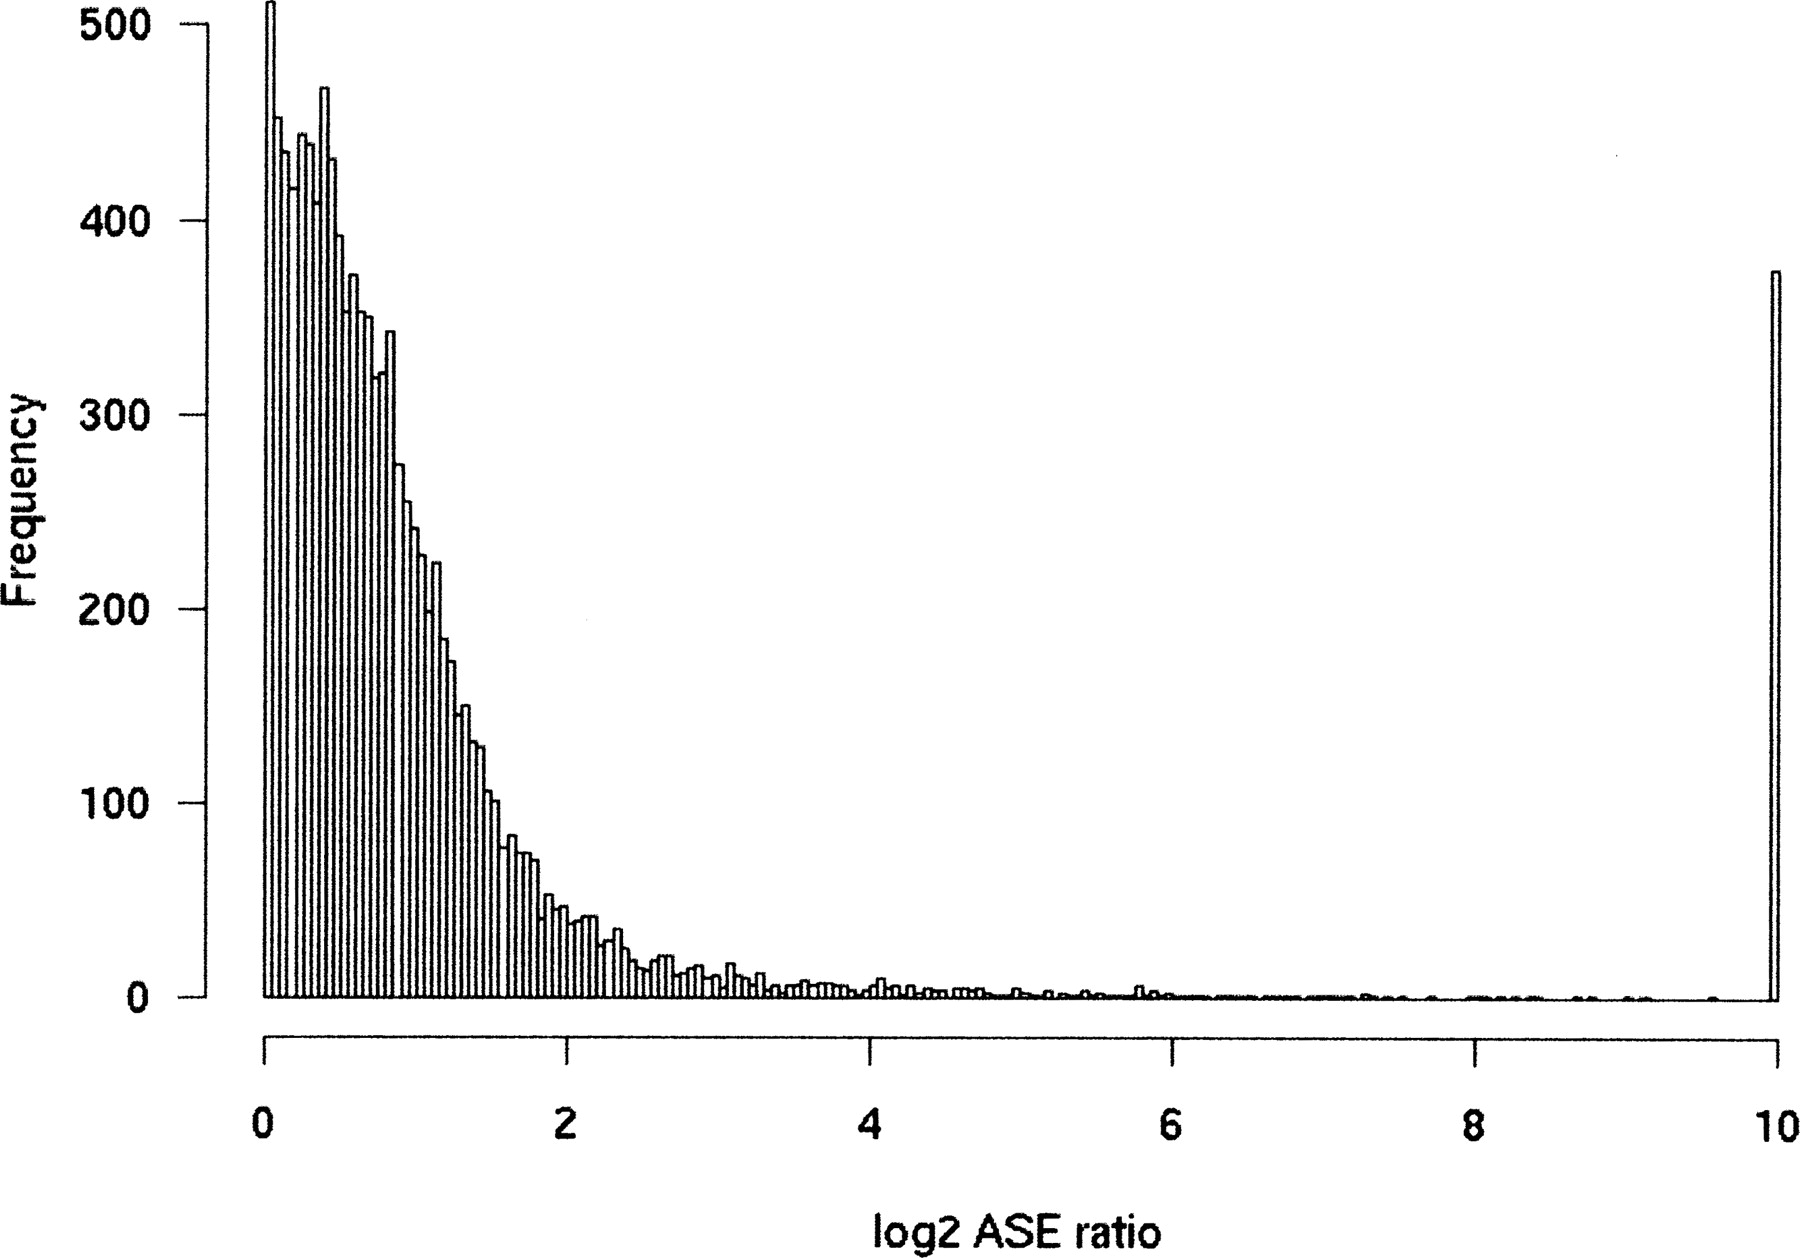
Figure 3.
Observed frequency of ASE skewing in six CEPH cell lines. Histogram of the absolute of log2 ASE ratio for SNPs in the top quartile of gene-expression level. Among these, 10% showed an ASE ratio >4.


