
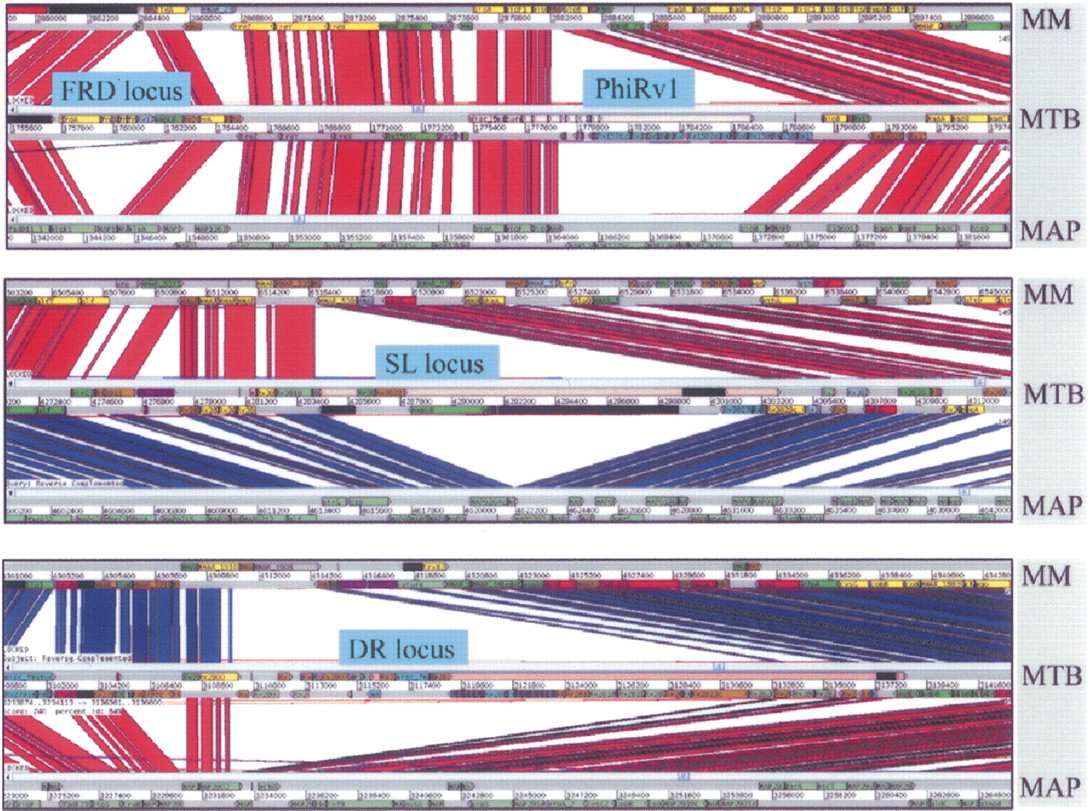
Figure 5.
Four examples of LGT in M. tuberculosis H37Rv as predicted by Alien_Hunter (sections highlighted in pink) and whole-genome comparisons with M. marinum and M. avium subsp. paratuberculosis, displayed using the Artemis Comparison Tool. Regions of DNA:DNA similarity are joined by red lines, while inverted regions are shown as blue lines (reversed and complemented here for clarity).


