
Figure 4.
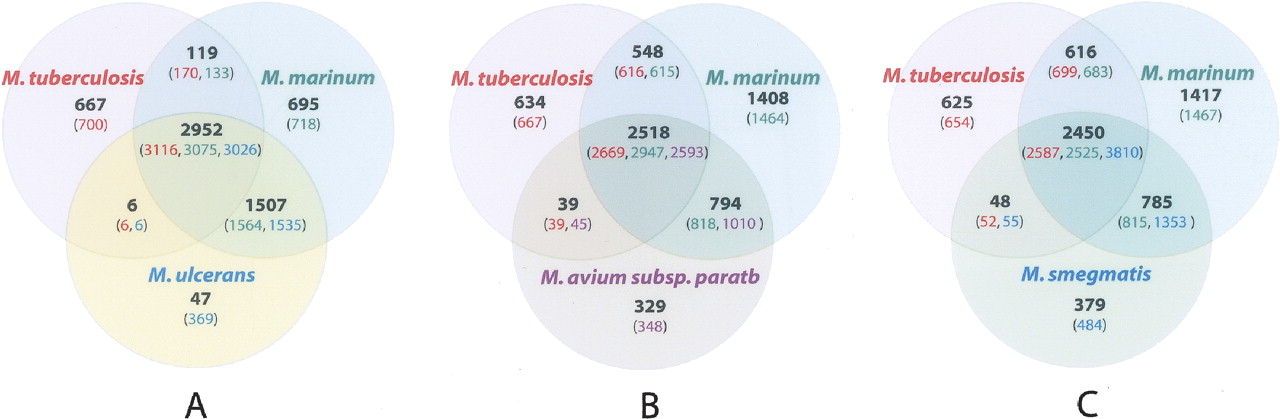
Venn diagrams showing orthologous CDS among four mycobacterial species as determined by BLASTCLUST analysis. Numbers in parentheses include paralogous CDS.
(Downloading may take up to 30 seconds. If the slide opens in your browser, select File -> Save As to save it.)
Click on image to view larger version.
Venn diagrams showing orthologous CDS among four mycobacterial species as determined by BLASTCLUST analysis. Numbers in parentheses include paralogous CDS.
 CiteULike
 Delicious
 Digg
Digg Facebook
 Google+
 Reddit
 Twitter
