
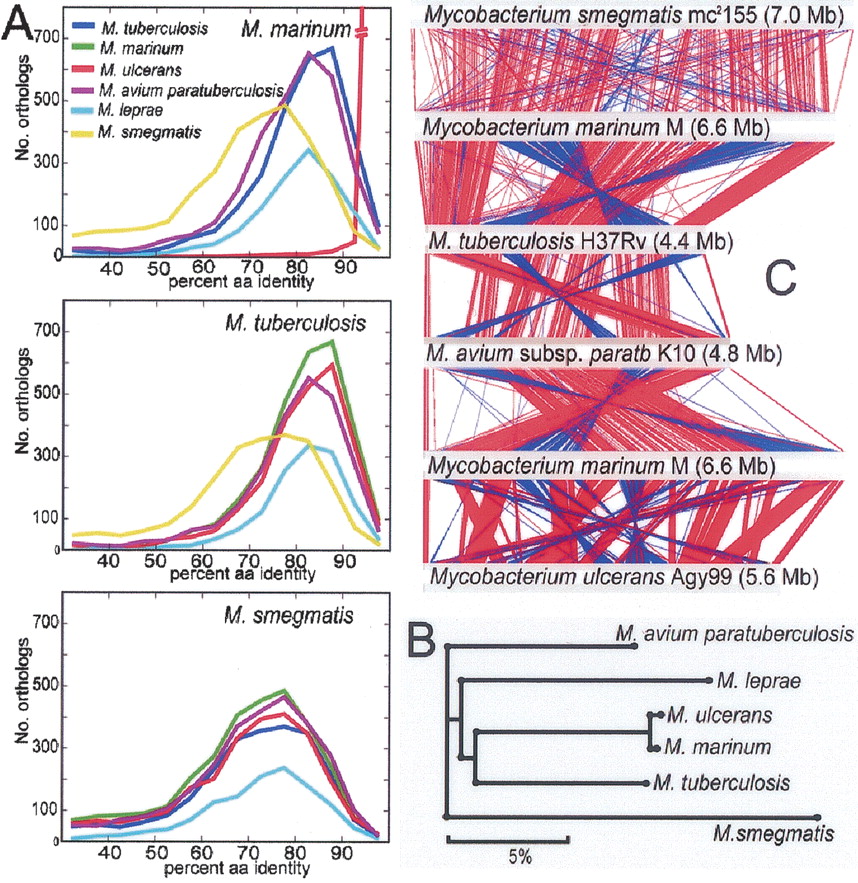
(A) Orthology frequency plots based on reciprocal best-hit FASTA analysis (refer to Methods) for each pairwise ortholog comparison among six species of mycobacteria. (B) Phylogenomic analysis of six mycobacterial species based on percent amino acid identity among 1072 core, shared orthologs. All nodes had >99.98% bootstrap support. (C) Diagram depicting linear genomic comparisons generated with the BLASTN, and displayed with the Artemis Comparison Tool (Carver et al. 2005) of (listed from top to bottom) M. smegmatis mc2155, M. marinum, M. tuberculosis H37Rv, M. avium subsp. paratuberculosis K10, M. marinum M, and M. ulcerans Agy99. Regions of DNA:DNA similarity are joined by red lines for direct matches, and blue lines for inverted matches.


