
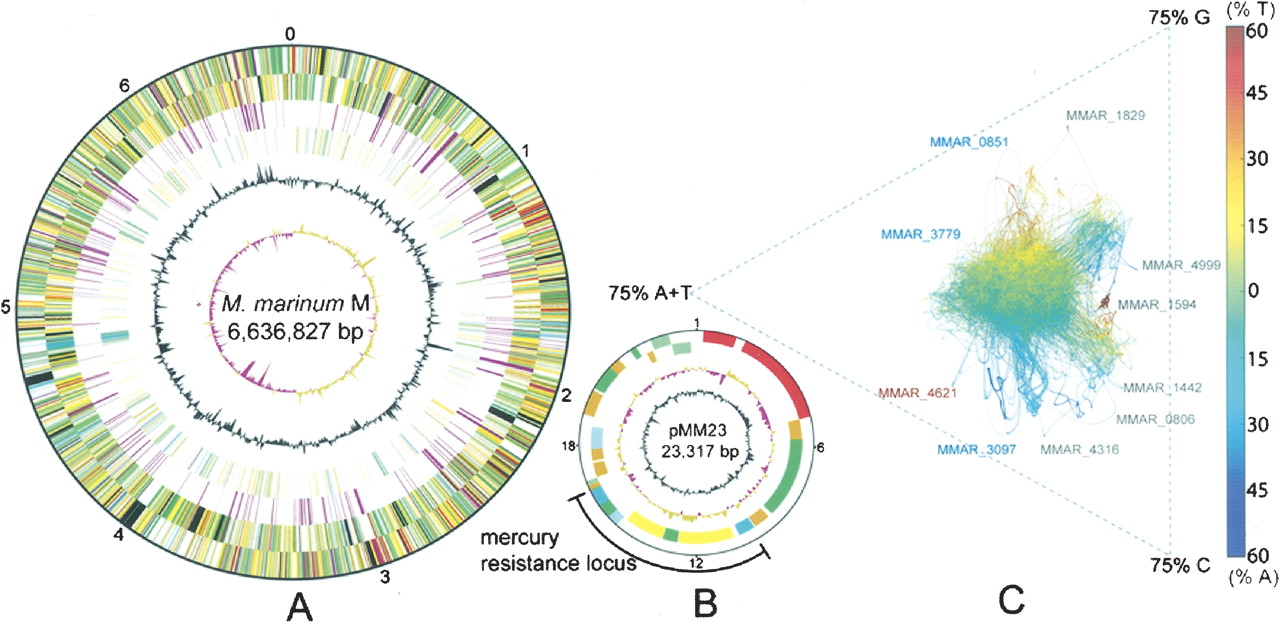
(A) Circular representation of the M. marinum chromosome. The scale is shown in megabases in the outer black circle. Moving inward, the next two circles show forward- and reverse-strand CDS, respectively, with colors representing the functional classification. (Red) Information pathways; (light blue) regulation; (light green) hypothetical protein; (dark green) cell wall and cell processes; (orange) conserved hypothetical protein; (cyan) IS elements; (yellow) intermediate metabolism; (gray) lipid metabolism; (purple) PE/PPE. The location of each copy of a PE or PPE gene is then shown (purple). The following two circles show forward- and reverse-strand genes that are not found in other mycobacteria (colors represent the functional classification), followed by the G+C content and finally the GC skew (G–C)/(G+C) using a 20-kb window. (B) Circular representation of the M. marinum mercury-resistance plasmid pMM23, following the same color scheme as the chromosome map but with a different scale in kilobase pairs as indicated. (C) AT skew analysis generated with Gene-Spaghetti, a method for visualizing DNA composition. The colors reflect AT skew (T – A)/(T + A). (Red) Extreme = 60% T-rich; (blue) extreme = 60% A-rich. The software uses a sliding Gaussian window to estimate local base usage (http://www.vicbioinformatics.com/genespaghetti.shtml). Outlier locus_tags were represented by three types of CDS; (blue) NRP; (gray) PE-PGRS; (red) PPE.


