
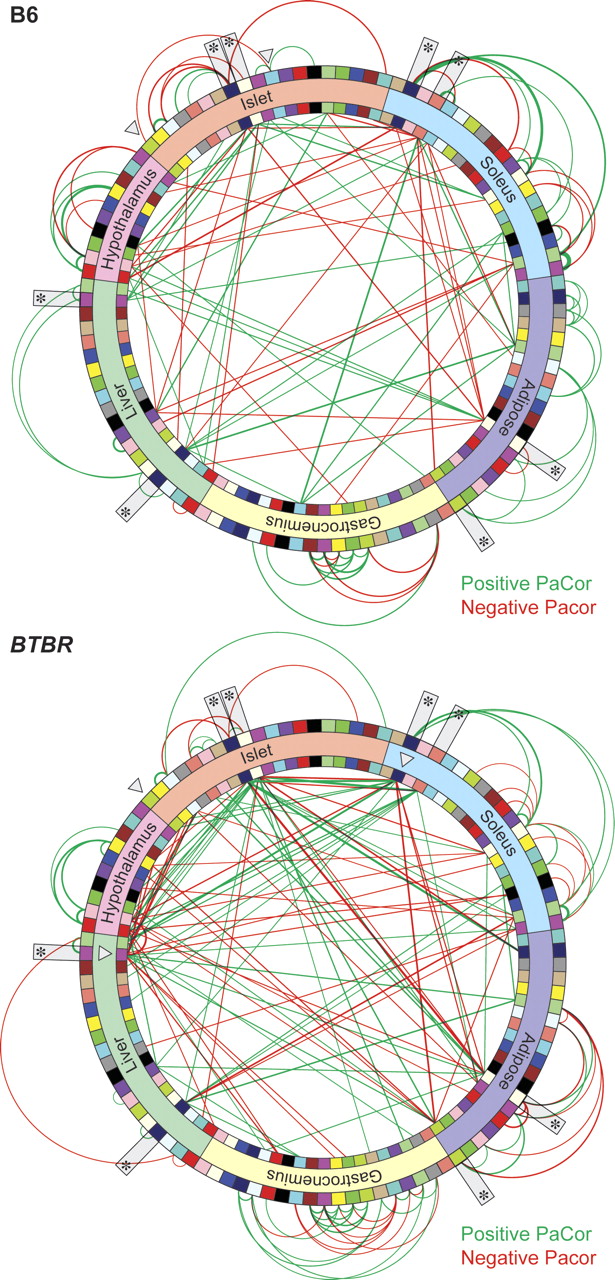
A gene-gene network model is distinct between B6 and BTBR mice. A gene-gene network was constructed based on the PaCor between the strain-specific PC1 calculated between all modules identified in the six tissues profiled. Modules are illustrated as colored bricks along the inside and outside of the network wheels and preserve the color scheme illustrated in Figure 2. Inter-tissue edges within the network are shown as lines connecting inside modules; intra-tissue edges are depicted as arcs connecting the outside modules. The cell cycle regulatory module in islet and those modules that form a direct connection to the cell cycle islet module are highlighted with open arrowheads. Network hot spots are indicated with asterisks. Line thickness is proportional to the magnitude of the PaCor, which ranged from 0.487 to 0.093 in B6 and from 0.303 to 0.086 in BTBR, for maximum and minimum, respectively. Positive predictive values for edge accuracy, obtained from simulations (see Methods), were on average 78% in B6 and 77% in BTBR. Red, negative PaCor; green, positive PaCor. Significance is set to control FDR at 0.5%. This figure is hyperlinked to our microarray gene expression database at http://diabetes.wisc.edu/kelleretal2008/fig4.php.


