
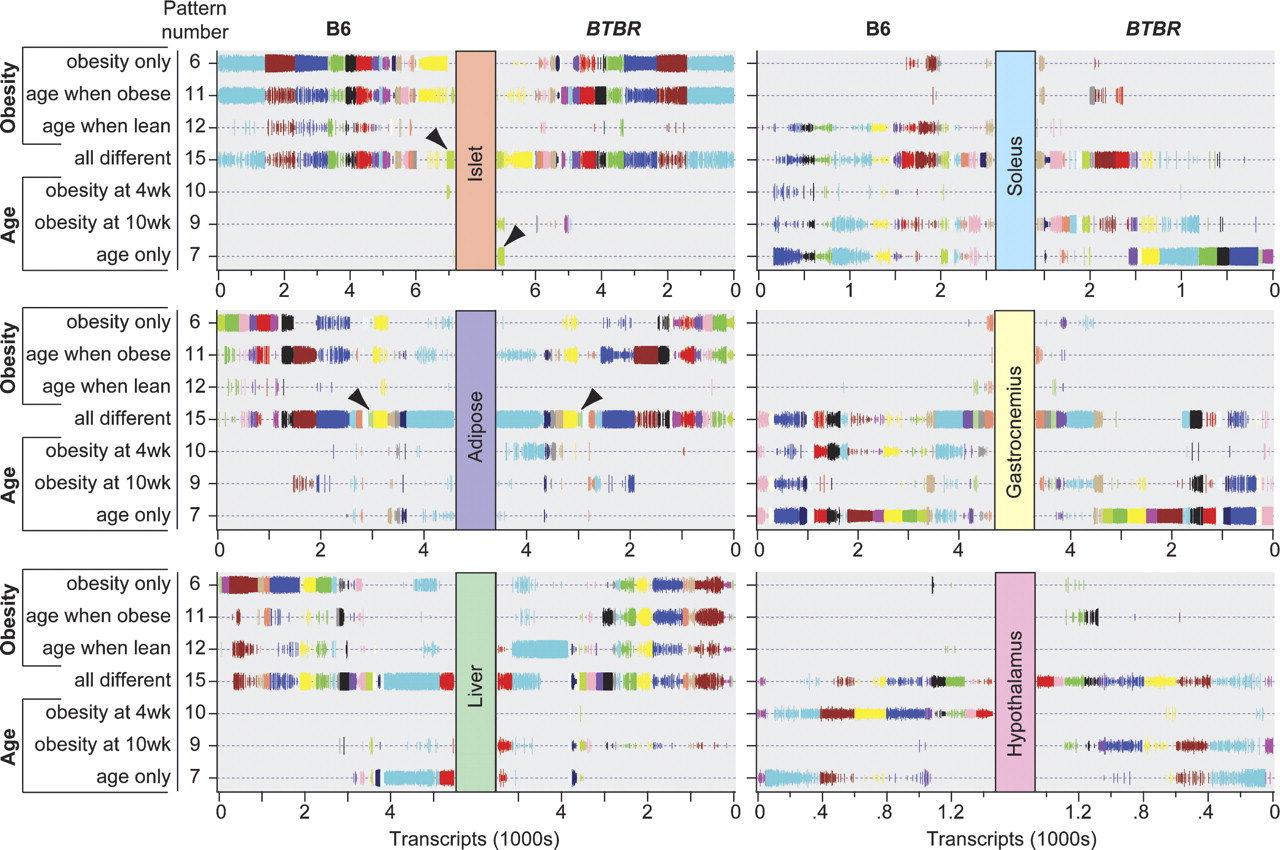
Co-expression modules can be deconstructed to show strain-dependent changes in transcript expression patterns. The strain-specific expression pattern for each co-expression module is illustrated for all six tissues profiled. The color of a particular module within one tissue is not related to that same color for a module of another tissue but is preserved across strains. The vertical size of the lines used to illustrate the module transcripts is proportional to the strain-specific posterior probability determination illustrated in Supplemental Figure S1. A decrease in the size of the symbols is evident in the hypothalamus compared to the other tissues, reflecting the decreased posterior probability cutoff (0.5) that was used for DE transcript identification in hypothalamus. For each strain and all tissues, every transcript has a unique expression pattern. Filled arrowheads highlight the cell cycle regulatory modules in islet and adipose tissue. Strain-dependent differences in expression pattern are evident when the pattern distribution for a particular color-coded module is shifted in the two strains. For example, the cell cycle regulatory gene set in islets largely shifts from pattern 15 in B6 to pattern 7 in BTBR (see arrowheads). This figure is hyperlinked to our microarray gene expression database at http://diabetes.wisc.edu/kelleretal2008/fig2.php.


