
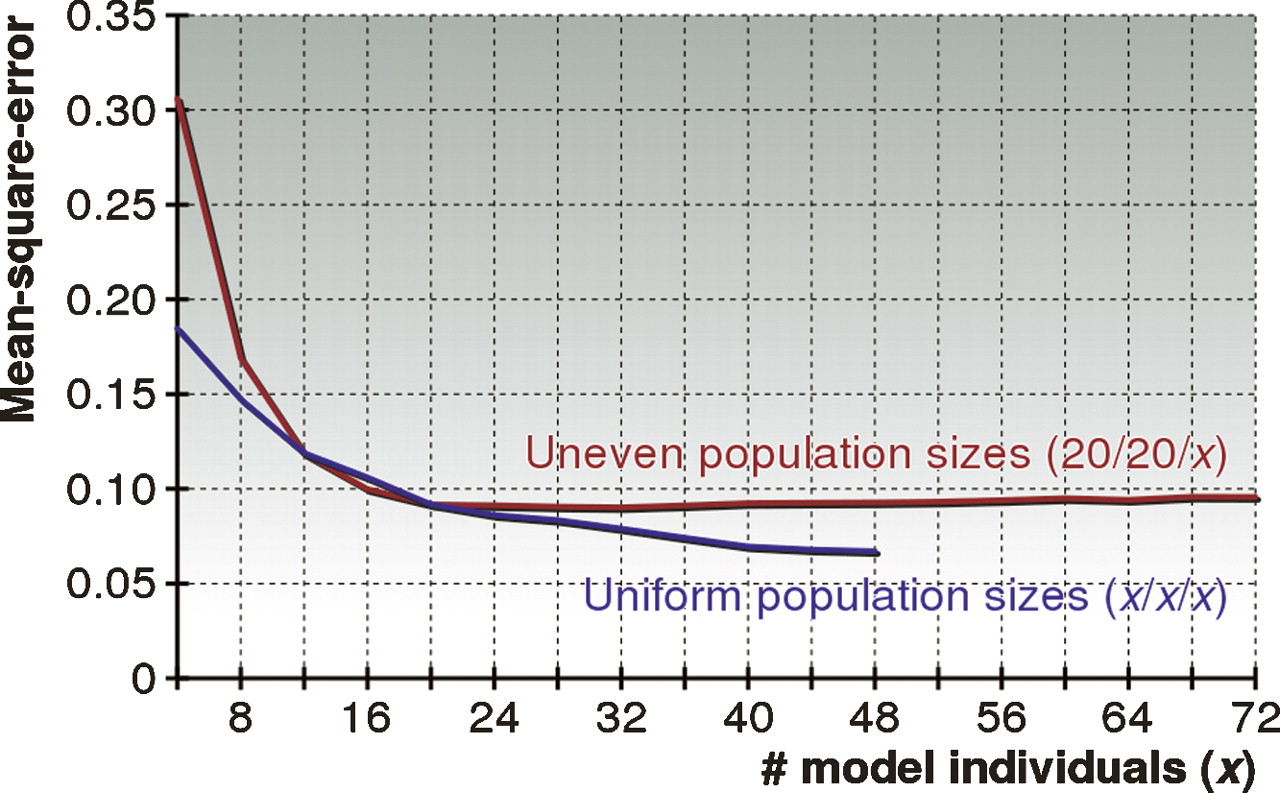
Figure 6.
Performance of HAPAA when varying the number of model individuals. We created models with a varying number of individuals derived from three populations in the HapMap data set within chromosome 22. For the “Uniform population sizes” we randomly picked x ∈ {4, 8, . . . , 48} individuals to model each population, while for the “Uneven population sizes” we picked 20 individuals from CEU and YRI and x ∈ {4, 8, . . . , 72} individuals from the ASN population. We benchmarked the mean-square-error performance of HAPAA on 1000 test individuals admixed over G ∈ {1, 2, . . . , 20} generations from the three populations.


