
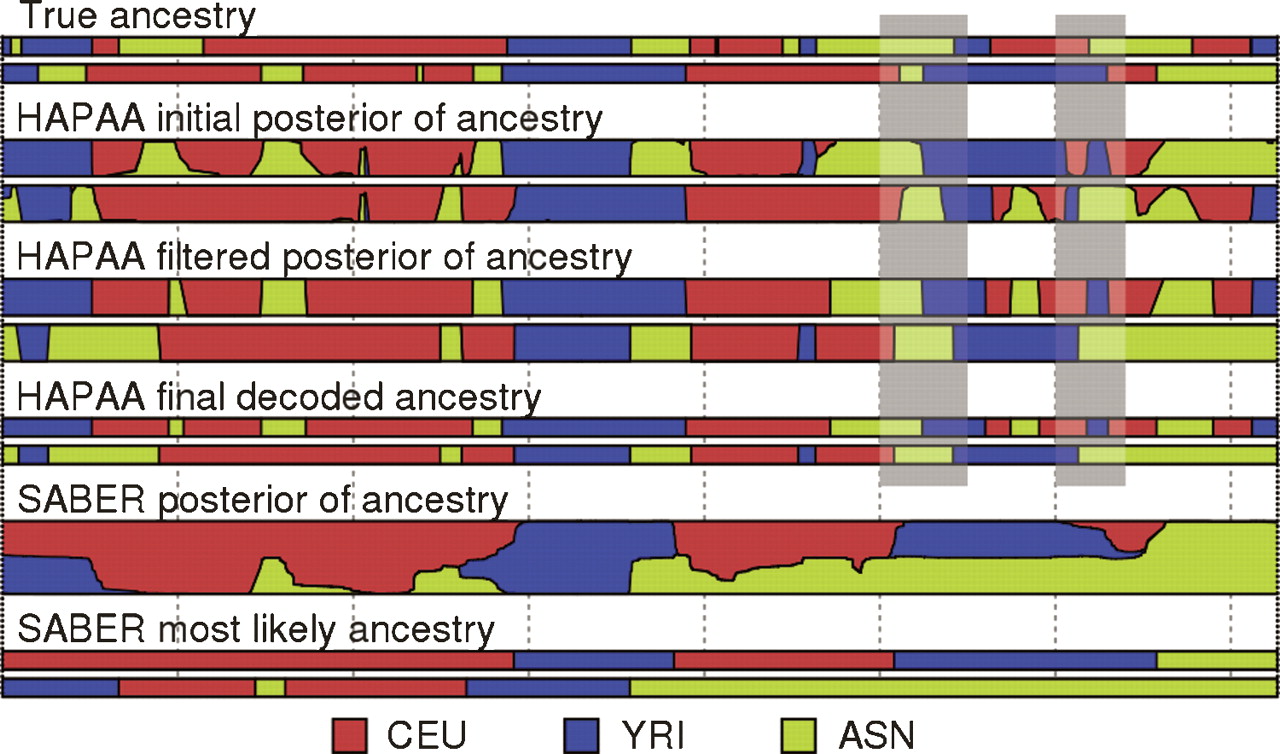
Figure 2.
Example inference on chromosome 22 of an individual admixed between three HapMap populations. The top two tracks represent the true ancestries, followed by three stages of HAPAA processing, and finally posterior probabilities and Viterbi decoding by SABER. The gray bars highlight two locations with correctly inferred ancestry but with phase switching errors between the haplotypes.


