
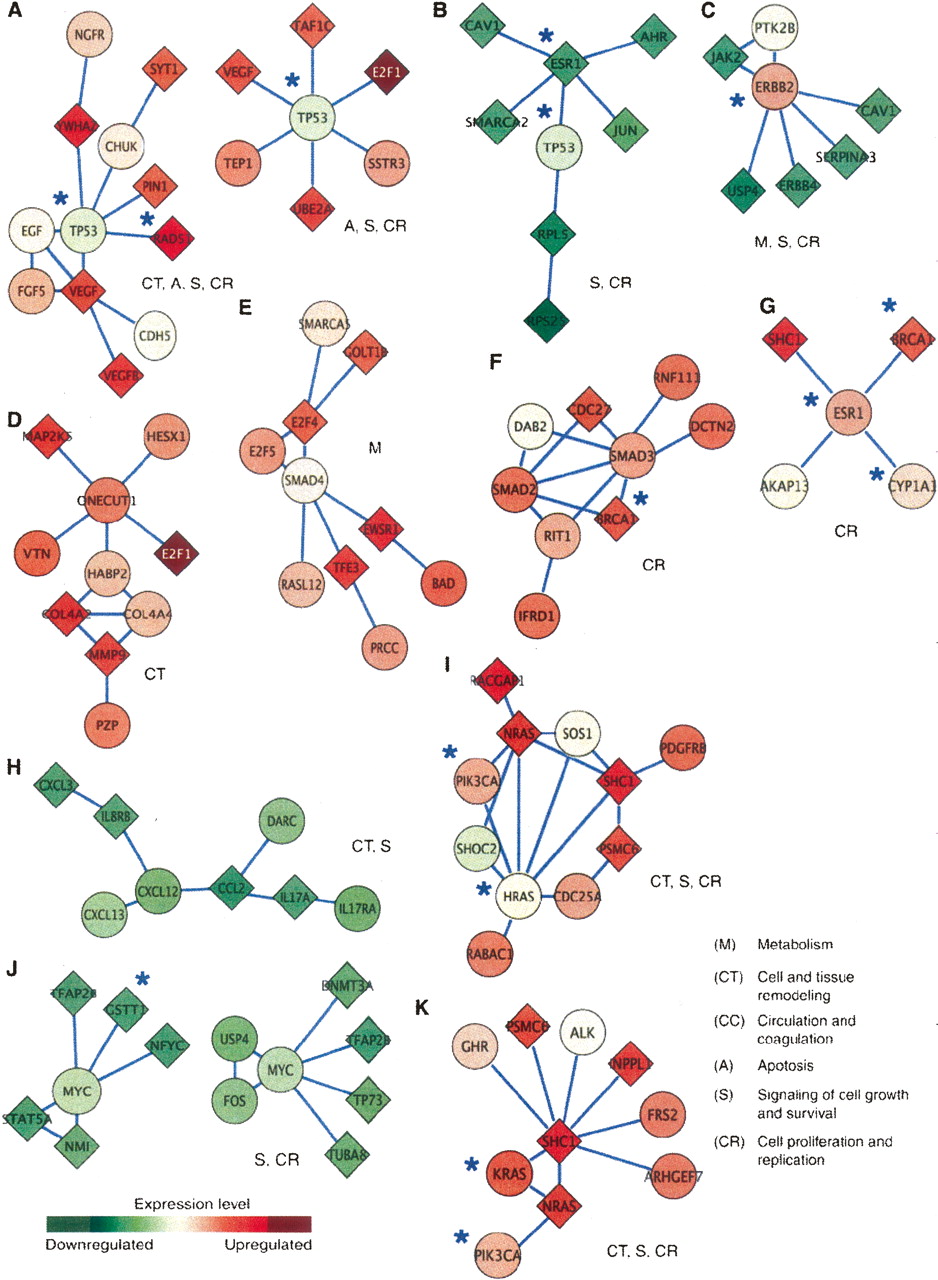
Discriminative subnetworks enriched with hallmarks of cancer. Vertices and edges represent human proteins and protein interactions, respectively. The color of each node scales with the change in expression of the corresponding gene for metastatic (red) versus nonmetastatic (green) cancer. The shape of each node indicates whether its gene is significantly differentially expressed (diamond; P <0.05 from a two-tailed t-test) or not (circle). The predominant cellular functions are indicated next to each module, and known breast cancer susceptibility genes are marked by a blue asterisk. Reproduced from Chuang et al. (2007) with permission from Macmillan Publishers Ltd. © 2007.


