
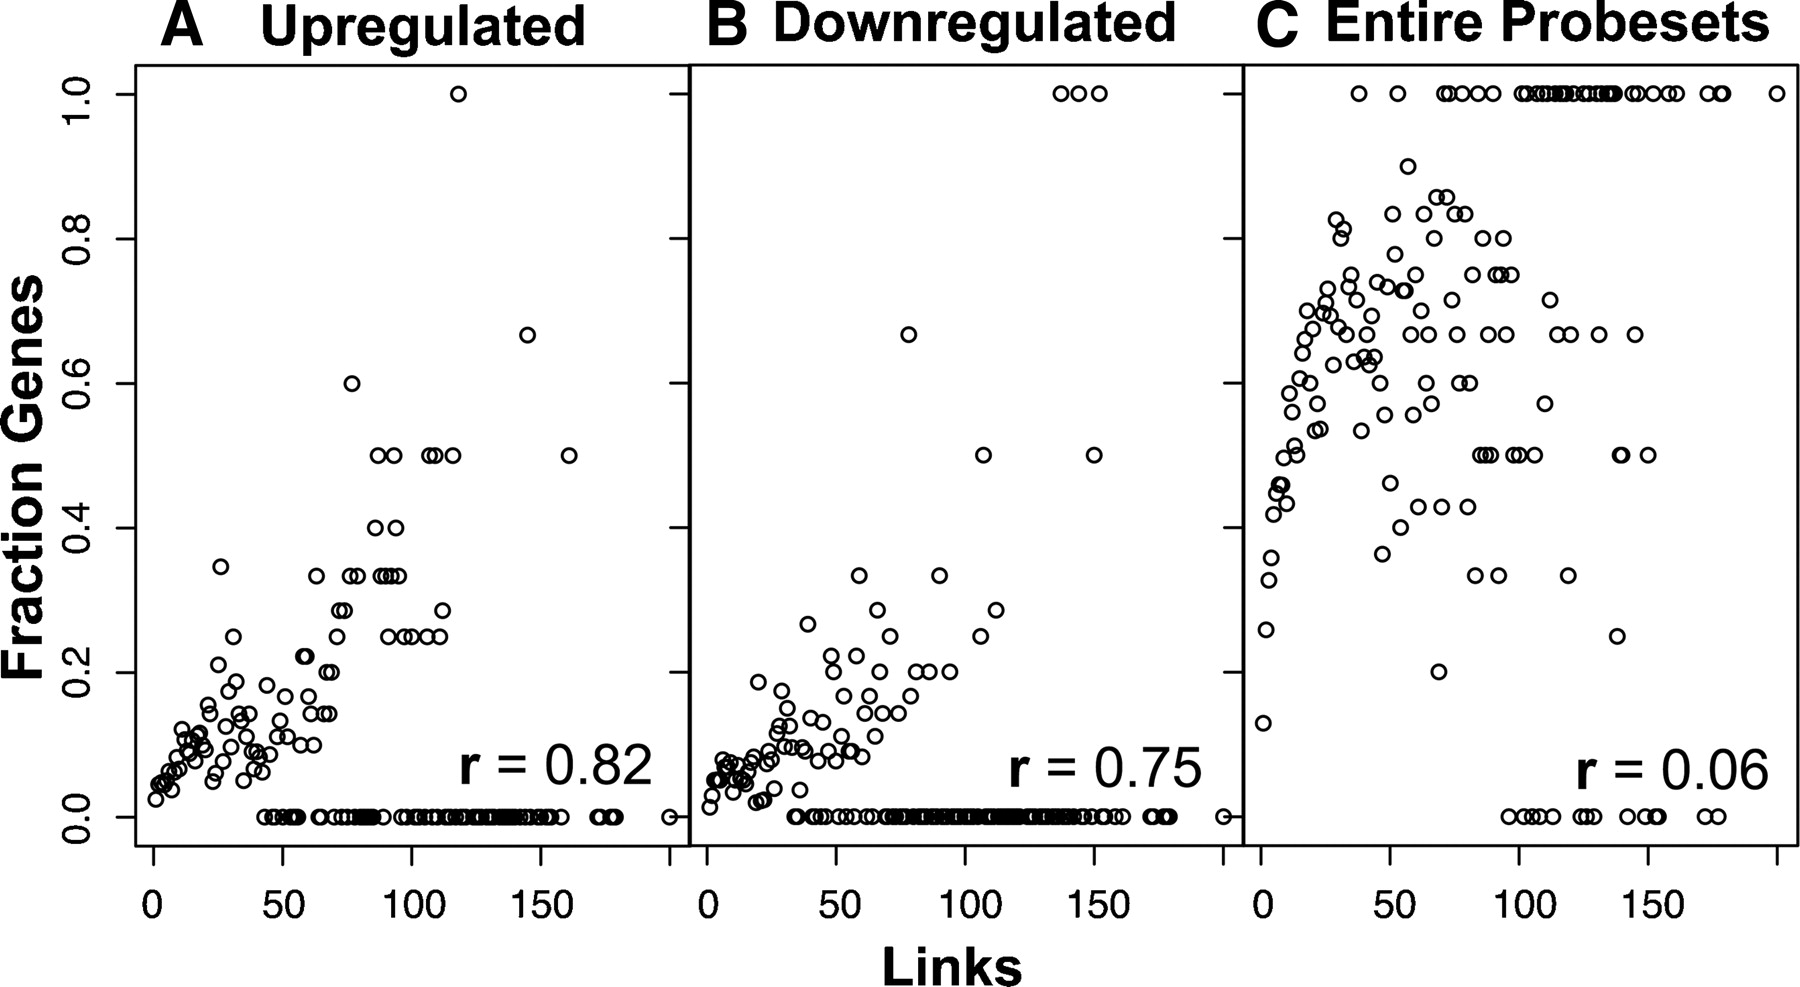
Figure 1.
Differentially expressed cancer genes tend toward higher network connectivity. Human proteins of each network degree (X-axis) were analyzed to compute their fraction of genes up-regulated (A) or down-regulated (B) in the microarray profiles of five lung cancer tissue biopsies. Both up- and down-regulated genes show significant positive correlation to protein degree, in contrast to the set of all genes on the microarray (C). Reproduced from Wachi et al. (2005) and reprinted with permission from Oxford University Press © 2005.


