
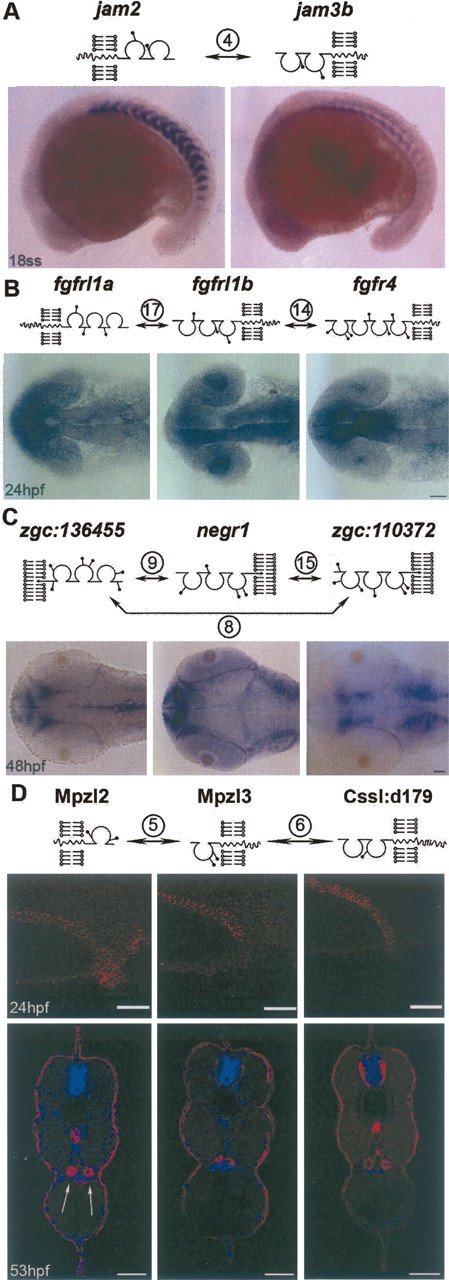
Expression patterns of genes encoding interacting proteins during early vertebrate development. Schematic diagrams representing the domain architecture and location of potential N-linked glycosylation sites are shown above the corresponding expression patterns. Whole-mount in situ expression patterns of zebrafish jam2 and jam3b at 18 somite stage (A), fgfrl1a, fgfrl1b, and fgfr4 at 24 hpf (B), and zgc:136455, negr1, and zgc:110372 at 48 hpf (C) showing complementary expression patterns. (D) (Upper panels) Lateral views of whole-mount embryos with anterior to the left showing Mpzl2, Mpzl3, and Cssl:d179 protein expression as detected by immunohistochemistry in the pronephric ducts at 24 hpf. (Lower panels) Immunohistochemistry of transverse 53-hpf zebrafish sections counterstained for nuclei with DAPI (blue) showing co-expression in the paired pronephric ducts (arrows) and epidermis (red). Scale bars = 50 μm.


